

ABSTRACT
A summary is provided of important considerations when designing key performance indicators as part of any performance management system. Technical, behavioural and psychological aspects are all touched upon. Important results from physics, statistics, information theory and control theory are all used to provide practical guidance. Key performance indicators – providing a ‘window’ so that the success or otherwise of a strategy can be judged and any necessary actions taken – are explored. The need is emphasised for SMART measures which can be influenced by the actions of those who are judged by them. Ensuring that the measures cover all areas in the form of a balanced scorecard, and are arranged in a hierarchy, is mentioned. Three different target-setting approaches for key performance indicators are discussed, viz. trending, benchmarking and best of the best. How the organisational culture and psychology will influence target setting is discussed. Accuracy, error and uncertainty of measures are explored, together with the need to measure frequently enough to spot changes. The need to separate signals from noise, and only take actions when significant changes occur, is covered. Drawing on control theory, the need to consider the delay between cause and effect in order to ensure stability of the performance management system is discussed. Finally, a checklist guide for key performance indicator essentials is included.
REASONS FOR INDICATORS
Key performance indicators close the input-process-output loop and link back to what was expected, and ultimately to the strategy. It is therefore only by monitoring key performance indicators that we can see if the strategy is actually working.
Key performance indicators are there primarily to see whether the strategy is working and where changes might be required. It follows therefore that the indicators themselves need to relate to critical success factors in the strategy itself. In other words, if safety features heavily in our strategy, then we might expect to see indicators based on near misses, incidents, accidents and staff behaviours. Indicators can also be used as a feed to the continuous improvement programme and to help with a review of planned maintenance routines and for supplier appraisals.
Indicators themselves must be part of a performance management system so that staff actually does what we want them to do in the most cost-effective manner. Just measuring something affects behaviour. For example, some would say, ‘I like to do what I enjoy doing and also what my boss measures’. So there needs to be careful choice of measures to ensure the behaviours we want are encouraged. For example, in recent years, short term profit measures in the banks have encouraged excessive risk taking by staff.
Measures should be linked to rewards for both staff and also key suppliers and service providers. Rewards themselves can be both financial and non-financial. No doubt we have all seen employee of the month awards when checking into hotels.
Whoever is measured by a key performance indicator must have the means and the time to influence its value. The measures need to be SMART, i.e.
- Specific/simple
- Measureable
- Achievable/acceptable/attainable
- Relevant/realistic
- Time bound
COVERAGE
An organization carrying out maintenance is like a machine; it has functions and needs to be viewed as a system. The coverage of indicators needs to be comprehensive without being excessive. With computer systems, it is possible to overdose on indicators. The operative word here is key indicators, so look for fewer than ten rather having, say, forty. We should think of our key performance indicators like food: not too much/many with a balance for good health.
The balance for indicators comes from a blend of:
- Financial (expenditure) and non-financial (number of jobs completed)
- Inputs (money, methods/expertise, materials/spare parts), processes (carrying out reactive jobs) and outputs (performance/availability)
- Leading indicators (near misses) and lagging indicators (accidents)
- Productivity (reliability), service (backlog, response times) and costs (budgets value of spare part stock)
Typical maintenance measures might include:
- Plant downtime
- Equipment reliability
- Percentage overtime
- Annual maintenance budget / capital cost
- Percentage of planned jobs completed on time
- Percentage of jobs which are breakdowns
- Costs versus budgets
- Value of spare parts
- Response times
- Backlog
Hierarchy of measures
The indicators need to form a hierarchy. The lowest level ones will be measures which frontline staff can influence. These can then be combined to give measures for the next management level, and so on. This is best illustrated by an example; there are five measures which the technicians and operators on a bottling plant can influence, viz.
- First time pass rate for quality
- Customer complaints relating to under-filling
- Mean time between failures (MTBF) for the filling head
- Mean time to repair (MTTR) for the filling head
- Number of cases produced per shift
- Product mix
The final measure, the product mix, cannot be influenced by the frontline staff. This is ultimately determined by what the customers are buying, but is also going to be affected by the organization planning, forecasting and levels of stock holding accuracies. It needs to be included though, because different grades have different maximum production rates and these rates need to be taken into account to give realistic targets.
The six base measures are combined into quality, availability and rate of working indices for each bottling plant, which are then rolled up into an overall equipment effectiveness measure (OEE). The OEEs for each bottling plant are then combined to give a measure of productivity for the whole organization.
Thus, the frontline staffs are judged on the base measures. The management of each bottling plant is judged on its OEE figure, which is derived from the base measures. In turn, the organization executives in head office are judged by the combined OEE figures for the whole organization.
TARGET SETTING
Having decided on which indicators to monitor, the next question to be asked is what should be the target values? Should the targets simply be last years’ ones; should they be ratcheted up a little; or should a tough target be set to encourage improvements? The answer turns out to be a mixture of science, organizational culture and psychology. Let us deal with the science first.
Averages and Trending
If our downtime has been variable last year, but the average (mean) figure has been 3%, we could set this as our target downtime for next year because it is representative of our downtime results. However, most variables are evenly distributed around the mean value so next year’s downtime is just as likely to be lower than this year’s figure as it is to be higher.
Trend analysis is often used when interpreting condition monitoring data or trying to predict what the year-end expenditure may be. It is simply plotting results on a graph, drawing in a line of best fit and then projecting it forward into the future. The greater the scatter of data points and the longer into the future the projection is made, then the greater the error in the prediction. Averages and trending will tend to produce representative targets which are not too challenging.
Best of the Best
If we were to set our targets on the best value which had ever been achieved to date, then that would be more challenging that using say an average value. But we can go much further than this – we can use the best of the best. To illustrate the principle behind this consider a golfer whose results for five half rounds of golf are shown in Figure 1, together with the par scores for each hole.
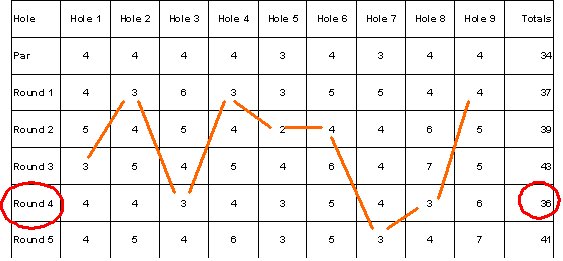
Anyone who has ever played golf will recognise the variation in scores between one round and the next one! The best score achieved was 36 from round number 4 (circled); the worst was 43.
The golfer could set a target of 36 for future rounds. This would be a target based on the best result. A more challenging target would be what is called the eclectic score: there are nine holes so what would be the total score if we could combine the lowest score for each hole irrespective of which round that score was achieved? These eclectic scores are connected by the heavy lines shown in the above diagram. Adding them together we get a total of 28. This is less than the par value for the nine holes that a professional golfer could be expected to achieve.
This eclectic score is an example of a best of the best value. The same principle could, of course, be used for expenditure, availability, task lengths, etc. Best of the best techniques produce very challenging targets, but the individual values have all been achieved, so it could be argued that these targets are achievable. Stretch targets such as these can therefore be used to accelerate improvements in performance.
Benchmarking
Benchmarking has been widely used to set targets. It can be done internally within a single organization or externally across different organizations. Internal benchmarking has the advantage that everyone is using the same organization procedures and, as confidentiality is not an issue, it is straightforward. Its disadvantages are that internal politics can distort the results; the initiative could also be seen as low priority and the opportunity for learning something entirely new is restricted. External benchmarking has the advantage that something entirely new could be learned by looking at an issue from an entirely different point of view. However, confidentiality could be a problem; there could be legal issues if competitors share information, and applying new procedures from another organization is not without risk.
Combination Techniques
One of the above target setting techniques could be used independently or several could be used in combination. For example, consider the table of Figure 2, where different aspects of maintenance have been established for four identical factories.
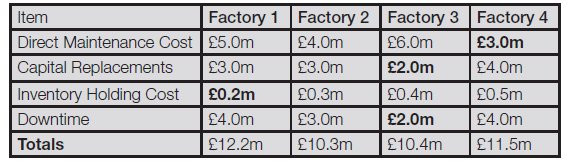
The benchmark factory in the above group is Factory 2. Its total cost of maintenance is the lowest at £10.3 millions. The lowest costs for each item making up the total cost of maintenance are shown in bold. Adding these together gives a total cost of £7.2 millions. This value was derived by benchmarking all four factories and then applying the best of the best principle.
Organizational Culture and Psychology
Organizations have personalities just like people: we can think of each organization having its own culture. One aspect of culture is how the organization will react if a key performance indicator does not achieve its target. If punitive actions would result, then one would be advised to set easily achievable targets!
Conversely, if an organization encourages the setting of stretch targets with reward for effort, even if a very tough target has not quite been achieved, then the best of the best could be used as a target setting technique. Incidentally, organizations which set stretch targets and don’t achieve them are often better off than those which always play safe because ‘If you reach for the stars you may get to the moon’.
Psychology also applies to key performance indicators. An incremental increase in a target will not trigger any different behaviour or searching for better solutions; people will just tend to continue to do the same things. However, a radically different target (such as halving plant downtime) will trigger out-of-the-box thinking and different ways of viewing the issues.
In the book “Good to Great” (2001) by Jim Collins great leaders were found to use ambitious targets as a way of driving up performance. After the USSR had achieved early successes in space President Kennedy announced that the USA would put a man on the moon within ten years. In the late 1960s Boeing decided to produce a wide bodied passenger aircraft (the 747) that would be far bigger and much more complicated than anything available at the time.
These two examples show how tough targets can be used to motivate. There is of course, a fine balance to be achieved between a tough target which will be difficult to achieve and one which staff think is impossible. Obviously, setting a target which everyone views as being impossible will just act as a de-motivator. High achievers tend to like the challenge from trying to achieve something which is viewed as being around 50% possible.
DETAILED CONSIDERATIONS
As far as key performance indicators are concerned, as with many things, the ‘devil is in the detail’. Error, accuracy, and dynamics need to be considered in any performance management system.
Accuracy, Error and Uncertainty
The accuracy required for our purposes must be established. For example, failure rates accurate to within a factor of two may be acceptable for reliability calculations, whereas expenditure must be tracked to the nearest penny. All parameters are uncertain to differing degrees, and, any signal will have some form of associated error and noise. This error will need to be assessed and taken into account within the performance management system.
Errors can be both systematic and random. Suppose our operators are asked to record downtime. If they are instructed to ignore all events which result in less than five minute’s downtime, then this will result in a systematic error and the recorded downtime will always be less than the true figure. If they are instructed to log downtime events to the nearest hour only, this will result in random errors in the measurement. However, systematic and random error can be assessed by a combination of calibration and repeated measurements.
Statistical techniques can be used to assess if a signal is above the level of expected noise. Clearly we only want to take actions when a significant change has occurred. Taking actions based on noise alone is a recipe for disaster.
Often the parameter itself can allow us to make some informed estimates of likely error. Suppose that safety performance is important and that we have decided to monitor the number of near misses each year. Last year’s figure was 4 and this year it was 3. Is it premature to start congratulating ourselves? Measures based on small, discrete, numbers tend to follow the Poisson distribution. The standard deviation of this distribution is always the square root of the mean value. The square root of 4 is 2, so we might expect that around 70% of the annual figures for our near misses will be in the range 2 to 6. Therefore, the figure of 3 near misses this year is not significantly different from 4 last year and congratulations would be premature.
It is important to be able to spot a gross error which might distort our key performance indicators. This is sometimes referred to as being able ‘to spot a stranger.’ Suppose one of our technicians has logged a series of vibration measurements as follows:
![]()
Suspicion falls on the value 26.54 because it is so much larger than the other values; for example, could it be that it was actually 2.65 which was wrongly recorded?
The highest number in this set is 26.54 and the lowest is 1.04, therefore the range is 25.5. If we ignore the suspiciously high number then the new range is 9.72 – 1.04 or 8.68. The ratio of these two ranges is 25.5 / 8.68 or approximately 3. If the high number were genuine, then this ratio should be no larger than 2. Therefore the large number is spurious and we should either take the reading again, or, if that is not practical, then ignore the large number and not use it because its inclusion will distort our analysis.
Frequency of Measurement
Some of the key indicators will be available continuously: motor electric current drawn by a critical piece of equipment, for instance. However, other indicators perhaps have to be measured periodically; therefore, we must decide how often this needs to be done. You may have noticed in old Hollywood cowboy films that the stage coach wheels seem to be moving backwards, even though, the stage coach is clearly moving forward. In older news reports the helicopter rotors sometimes appear to be moving erratically, instead of smoothly. Both of these examples are the result of the shutter speed of the camera being too slow to accurately record the movement.
In order to record a parameter faithfully it must be sampled at double the highest frequency it exhibits. (See Hartley / Tuller / Shannon sampling theorem, 1948). Therefore, to faithfully record audio signals on a CD, the digital samples are recorded at 38 kHz since the highest audio frequency present is 19 kHz. If we consider that pump performance will deteriorate over a 12 week period, then we must check it at least every 6 weeks. There is no harm in sampling more often, provided high costs are not involved, as the sampling theorem merely says what the minimum needs to be.
System Response
Key performance indicators are part of a method or system. All systems take time to respond and this response time needs to be taken into account, otherwise, the result will be wild oscillations in the measured values.
Consider this scenario. I go into my kitchen first thing in the morning and turn on the hot tap. For a period of time the water remains cold as all of the standing water in the pipe between the tap and the hot water tank is displaced. Then the water temperature starts to rise, this is not immediate, because, the hot water loses some energy as it warms the pipework between the hot water tank and the tap. Eventually, the hot water achieves a steady value. A plot of hot water temperature at the tap versus time will look like that in Figure 3.
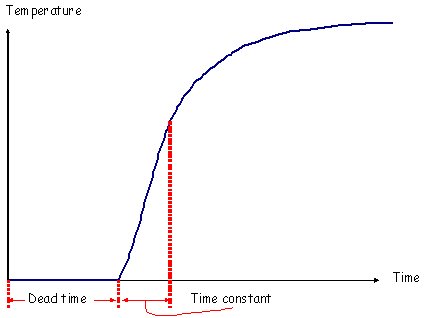
The behaviour shown in Figure 3 – a dead time followed by a characteristic rise time – is the simplest response a system can exhibit. More complex systems can exhibit longer delays and more complicated response curves. Whenever a change is made to our system, it will take time for the key performance indicator to change its value. If we expect an immediate change and keep making changes until something eventually happens then the indicator will eventually overshoot and further changes will result in continued oscillations. We need to be patient and, after making a change, wait until after any dead time period and characteristic time constant, to see what the true effect the changes have had. That way, the performance management system will stay in control.
CONCLUSIONS
Maintenance key performance indicators provide a window on our strategy; they let us see how well it is working. In order to achieve a robust performance management system we need to be careful in our choice of measures, to consider imperfections in them, the delay between cause and effect and how they will influence behaviours.
Checklist of Key Performance Indicators Essentials
- Simple performance measures for service, performance and cost, linked to the organization’s needs, are displayed, understood and owned by all
- Global, comprehensive and accurate equipment history system with a standardized asset structure facilitates internal and external benchmarking activities
- Trends in maintenance and reliability performance are recognised and root causes sought
- Plant key performance indicators are built into a hierarchy which is used by the organization-wide performance management system
- Stretch targets are used to accelerate improvements in performance
THE AUTHOR
Paul Wheelhouse is a director with the consultancy company Red Wheel Solutions, which specialises in maintenance, asset management and reliability improvement. (For further details see www.redwhweelsolutions.com) He is also a visiting lecturer with Manchester University where he lectures on the Maintenance & Asset Management MSc programme. Together with Stuart Emmett, he co-authored the book called Excellence in Maintenance Management, ISBN 978-1903-499-65-8.