

ABSTRACT
An earlier article by the same authors, published in the July 2013 issue, described the development of a condition monitoring system for the machinery in a coal workshop of a typical cement plant. Here, the application is outlined of a simplified and systematic vibration-based diagnosis for enabling the early detection of faults in that machinery, an application which is expected to enhance the safety and availability of the plant concerned.
INTRODUCTION
Health assessment of industrial machinery through vibration-based techniques is widely regarded as one of the most generally applicable of condition monitoring techniques. This is mainly due to the fact that all machines and structures vibrate, and that the vibration signature can be directly linked to the operational state of the entire machine or its associated components (bearings, rotors, impellers, blades, gears, etc.). A very prominent merit of vibration-based monitoring lies in the fact that each and every cause of vibration in a machine (imbalance, misalignment, looseness, broken rotor bars, gear wear/breakage, damaged couplings, bearing faults, etc.) has its distinctive feature, which is often identified through the excited frequencies.
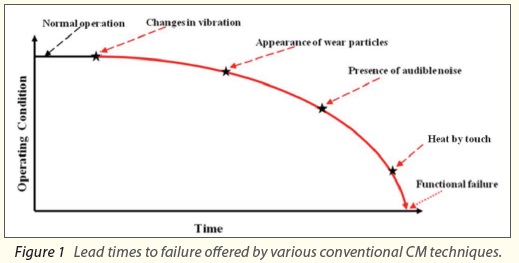
Vibration-based condition monitoring (VCM) has over the years enjoyed a very significant level of popularity, due to its versatility and ability to promptly detect the least of changes in machine operation which could lead to eventual downtime. Additionally, VCM has been described in some earlier studies as the class of condition monitoring (CM) techniques with the capacity to offer the longest lead to machine failure. Hence, the proper trending of measured vibration data is of immense value when trying to discover sharp deviations from the normal operating conditions of machines – which could be due to improper maintenance activities (e.g. wrongly fitted machine components), operational problems, faulty design or installation, or machine ageing. Figure 1 gives a general comparison of the estimated lead times to machine failure offered by some of the widely used, or ‘conventional’ CM techniques.
An initial case study, reported in Issue 14.3 of this journal (see Reference), of a cement manufacturing plant’s coal work station established that CM should be used on the most availability-critical machines (identified through a risk-priority analysis based on the impact of failure on safety and environment, on repair time, on downtime cost implication and on degree of system redundancy), viz. the coal mill proper, the coal mill drive assembly, booster and bag house fans and bag house. It was also shown that the CM system proposed for these critical machines would apply vibration analysis as its fundamental fault detection technique, while using thermography and lube-oil wear-debris analysis as confirmatory techniques. Furthermore, the study also provided a detailed cost/benefit analysis and justification of the proposal, based on the approximate CM cost and plant downtime cost.
The work reported here is essentially an extension of the above study providing information that will aid the diagnosis, using vibration analysis, of some of the common faults occurring in the same machines (using the coal mill main drive assembly and bag house/booster fans as illustrative examples). This information is, however, transferable to other classes and types of rotating machines in other, and different, industries.
VCM PROCESS FRAMEWORK OVERVIEW
VCM applies vibration-based techniques for the determination of the actual operational states of machines, so that appropriate maintenance decisions can be taken upon the suspicion of unacceptable variations from the normal operating conditions. Figure 2 is a schematic of the major activities involved in a VCM process.
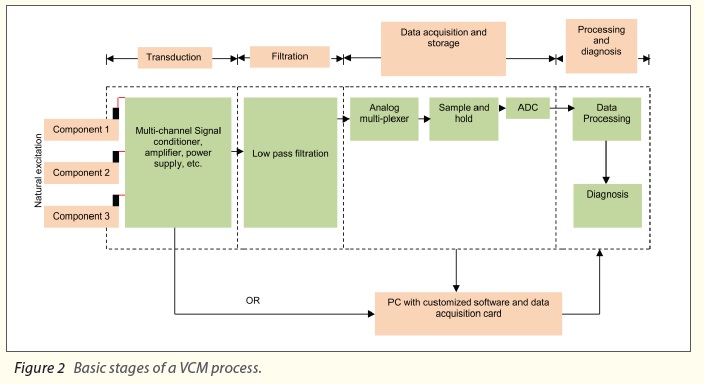
The vibration data from machines are often acquired through the aid of transducers (acceleration, velocity or displacement), which convert the measured vibration into a appropriate signal, usually a voltage. A major point of consideration when selecting the measurement parameter (i.e. acceleration, velocity or displacement) is the frequency of interest. Irrespective of the case, however, a significantly large signal is usually needed to obtain a good signal-to-noise ratio, which is the reason for the amplification and signal conditioning elements shown in Figure 2.
Noise may originate from electrical connections to the measurement transducers themselves, or from other sources of interference with the signals from the measured machine (e.g. from adjacent machines). The application of a low pass or anti-aliasing filter (designed to eliminate frequencies higher than half the sampling rate) is highly recommended, in order to avoid the appearance of high frequencies in the low frequency regions.
A commonly applied rule of thumb proposes the use of displacement sensors for low frequency measurements, velocity sensors for middle frequency measurements, and acceleration sensors for high frequency measurements. This is mainly due to the fact that the stiffer the sensor, the higher its natural frequency of operation, which is why accelerometers are very stable in the higher frequency regions. Velocity sensors, on the other hand, have large masses, lower stiffness and a correspondingly lower natural frequency, which is why they enjoy good stabilities at frequencies lower than their natural frequencies.
Another vital point to note during vibration data acquisition is that the degree of repeatability achieved with vibration sensors such as accelerometers is highly dependent on their mounting styles (stud, adhesive, magnet or hand-held), especially when dealing with high frequency faults such those suffered by bearings. This therefore implies that the sensor linearity range diminishes in direct proportion to the mounting stiffness, which is why measurement repeatability will reduce from stud-mounted sensors to hand-held sensors.
Once the complex machine vibration data (characterised by several frequency components at different amplitudes, due to the different forces generated by each machine component) is accurately collected, it can then be processed using time domain, frequency domain or time-frequency domain analyses. The final stage of the VCM process is the diagnosis of the fault, where the different features observed from the processed vibration data are matched to suspected machine faults (e.g. misalignment, shaft rub, looseness, crack, etc.) as well as the defective machine component.
TECHNICAL SPECIFICATIONS OF CRITICAL MACHINES
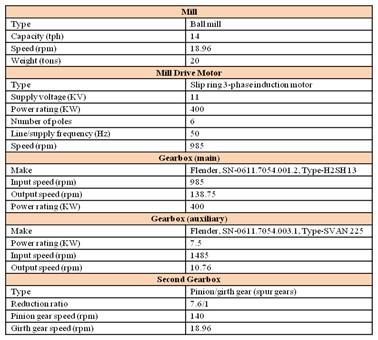
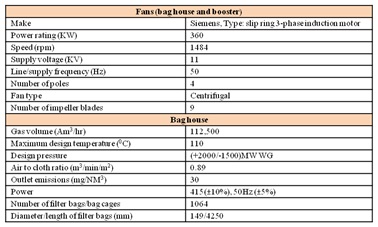
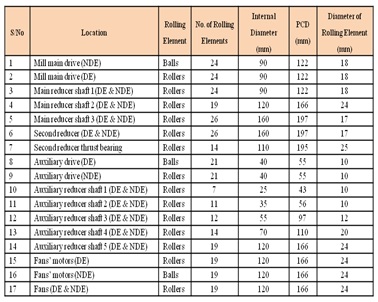
A summary of the main technical details of the coal work station critical equipment (as determined through a risk-priority analysis in the introductory part of this study), along with some of their vital components is presented in Tables 1-4.
PRACTICAL IMPLEMENTATION OF VCM ON THE CRITICAL MACHINES
Coal mill main drive assembly, bag house fans and booster fans
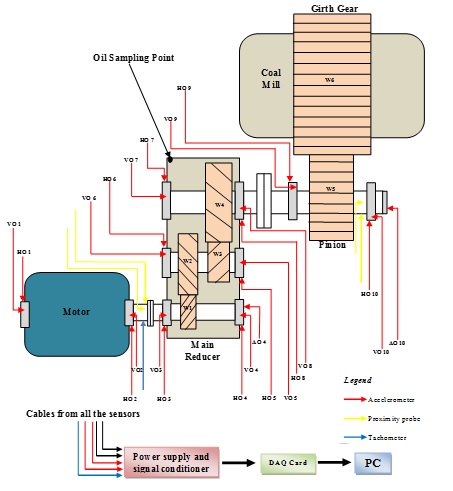
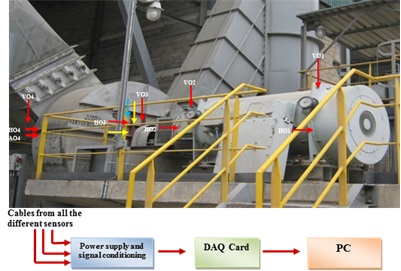
As shown in Tables 1-4, the fault-prone components on these units are the gears, bearings, couplings, shafts, impeller/blades and electric motor. Figures 3 and 4 respectively show the schematic and pictorial representations (with the positions of the various VCM sensors) of the coal mill main drive assembly, bag house fan and booster fan.
Fault detection and diagnosis
The general concept of VCM is not new to most organisations (including that of the chosen case study). Here, however, some fundamental guides will be provided that may further enhance the effective identification in practice of common causes and sources of machine vibration.
Gear faults
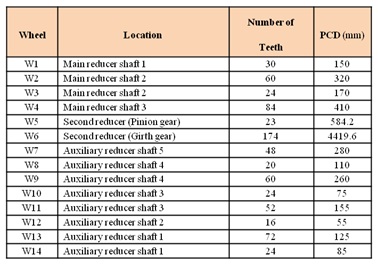
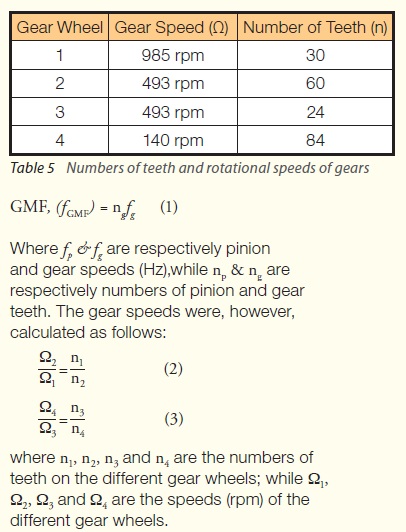
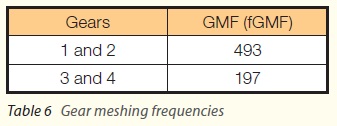
In order to differentiate various faults (wear, misalignment, crack, eccentricity, hunting, etc.) associated with gears it is very important to know the gear meshing and hunting frequencies (GMF and GHF) in this particular case – as faults will usually excite one or more of these frequencies. These have been summarised in Table 6, and calculated using the information provided in Table 5 and Equations 1-3.
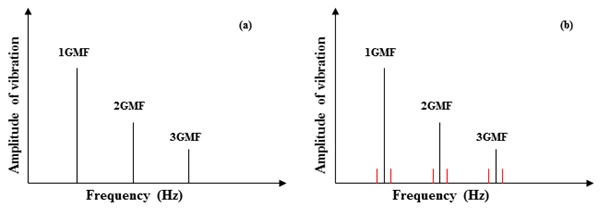
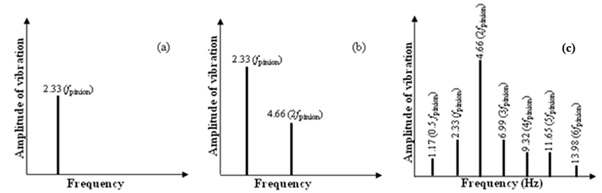
Having determined the gear defect frequencies, the likely spectral appearances for some gear faults can be assessed and are shown in Figures 5 and 6. Figure 5(a) shows a tooth wear fault, with the excitation of the GMF and its higher harmonics. Figure 5(b) shows the likely spectral appearance of a cracked tooth fault, similarly showing the excitation of the GMF, its higher harmonics, with side bands. When the sidebands spacing corresponds to the pinion frequency, the crack is in the pinion gear. On the other hand, if the sidebands spacing corresponds to the gear wheel frequency, then the crack is in the gear wheel. These figures only represent typical patterns, an aid to fault diagnosis, the exact amplitudes being very dependent upon the severity of the fault.
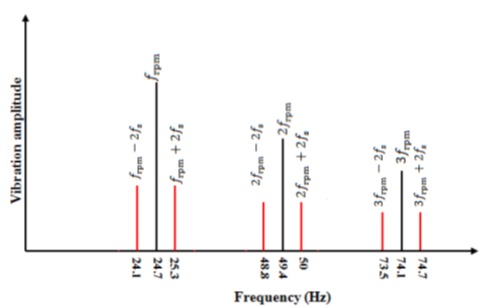
Electrical faults
In the diagnosis of faults with electrical origins, the pole pass and slip frequencies are vital, and have been determined as 0.25 Hz and 1.5 Hz respectively, using Equations 4 and 5.
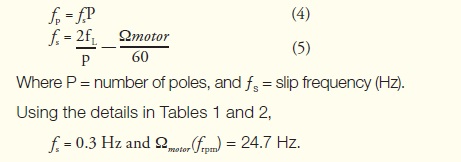
Hence, a likely vibration spectral pattern for an electric motor with cracked or broken rotor bars might be as shown in Figure 7 (An illustration only; in practice. the spectral patterns and vibration amplitudes will vary according to fault type and severity level).
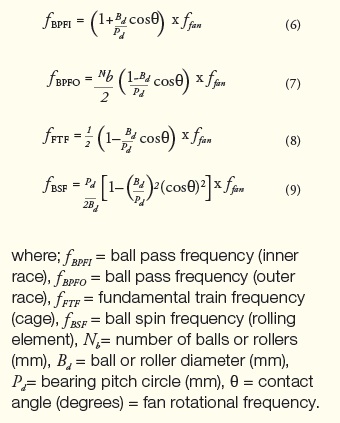
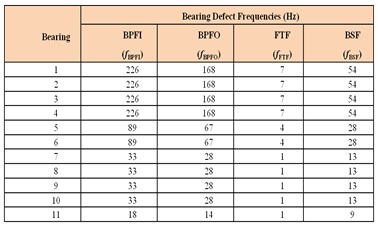
Bearing faults
Studies have shown that many of the failures of machines such as electric motors result from failures in their bearings. Bearings are composed of four basic components, namely cage, balls or rollers, inner race and outer race. Faults in bearings will always excite one or more of the characteristic frequencies of these components, which can be estimated using Equations 6-9 and, for the case studied are displayed in Table 7.
Fan faults
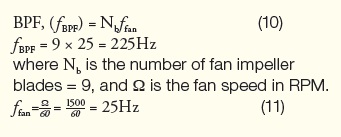
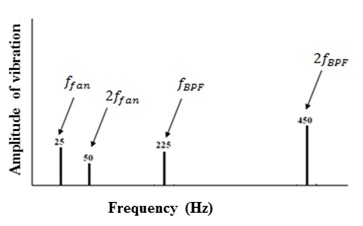
The blade pass frequency is a very vital parameter for vibration-based diagnosis of faults in fans. Equations 10 and 11 were used to calculate the blade pass frequency (BPF) for the bag house and booster fans, while Figure 8 shows the likely spectral responses due to faults. Although the fan consists of other vital components (e.g. bearings, electric motor, shaft, etc.) besides the impeller and blade, the details that have been provided here – and in Figure 10 (see later) – are directly applicable.
SUMMARY OF DIAGNOSTICS FEATURES
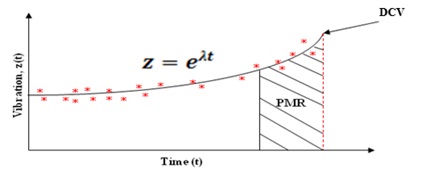
In order to enjoy the full benefits of VCM a philosophy that ensures that machinery vibration data are accurately trended has to be established. Accurate machinery vibration trends provide indications of changes in the operational conditions of critical plant machines, which are required for the planning of cost-effective maintenance interventions (prior to functional failures). These trends can be plotted for the different points of vibration measurements on a critical machine, so as to quickly detect sharp changes in machine operation as well as the origins of the changes.
Figure 9 shows a trend graph for one of the measurement points on the bag house fan, where, DCV and PMR respectively denote ‘damage causing vibration’ and ‘possible maintenance region’. It should, however, be noted that the determination of PMR will vary from plant to plant, based on factors such as proximity to spares, suppliers, delivery lead time, etc.
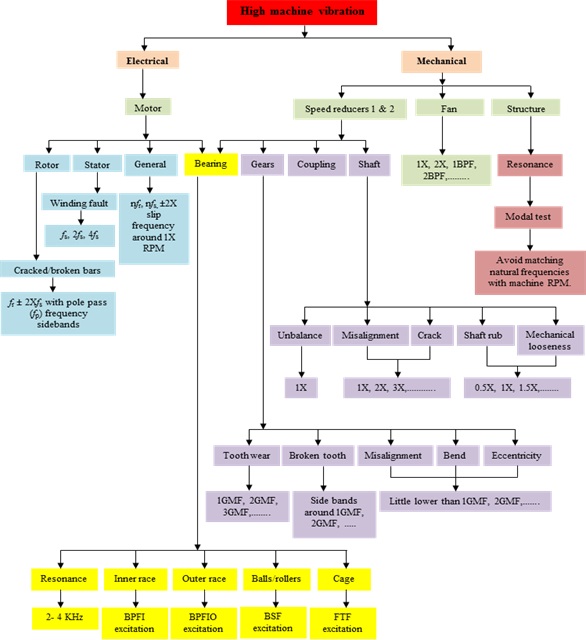
With vibration monitoring forming the core of the proposed CM system, Figure 10 presents a fault tree summarizing some of the characteristic diagnostic features of different faults occurring in the different components of the identified critical machines.
CONCLUSION
A simple exercise such as that demonstrated in this case study, combined with accurate trending of vibration data, can aid the effective diagnosis of machine faults.
ACKNOWLEDGEMENT
We wish to fully acknowledge the support for this work provided by AshakaCem PLC (a subsidiary of Lafarge Cement PLC).
REFERENCE
Yunusa-Kaltungo A and Sinha J K Demonstration of Condition Monitoring through a Case Study. Maintenance and Asset Management Journal, Vol. 13, No. 4, pp 50-55 (2013).