

ABSTRACT
Part I (in Issue 17.1) explained that analysing the frequency spectrum is not the only way of monitoring machine vibration, and that measurement and analysis of phase, which is neither difficult to do nor to understand, can enhance the ability to correctly diagnose machine faults. The fundamentals of phase analysis were then reviewed, and the measurement of phase – with a single (or dual) channel data collector and strobe – explained Part II shows how these measurements can be used to diagnose a wide range of machine fault conditions: imbalances, misalignments, eccentricities, etc.
INTRODUCTION
While spectra and time waveforms can provide an indication of a fault condition, quite often phase readings can help to confirm the exact nature of the condition, helping to distinguish different conditions that have similar vibration patterns.
By collecting phase readings at different points on a machine we can determine if it is correctly balanced; if the shafts or pulleys are correctly aligned; if the bearings are cocked on the shaft; if there is run-out or eccentricity; if a shaft is bent; if a foot is cracked or loose; and more. We can also use phase readings to provide an indication of a resonance condition.
The correction of these problems will greatly improve the reliability of the machine; extending its life and, in some cases, producing products of higher quality. Missing the diagnosis will ultimately reduce profitability. And misdiagnosing the condition will waste time, labour, parts, and increased downtime.
RELATIVE PHASE READINGS
We utilise relative phase readings to diagnose fault conditions. We do not care what the actual reading is on top of the motor; we are only interested in how it compares to the reading on the side of the motor and the reading at the other end of the motor. If they are in-phase, that tells us something. If there is a 90° difference (approximately), then that tells us something. And if the difference between the readings is something else altogether – 132° for example – then that also provides useful information. We can do this by taking phase readings at each of the key locations on the machine relative to a reference (typically the tachometer), and then comparing the readings between each of the points. Better still, with a two-channel data collector we can perform relative measurements between each of the points and simply record the difference. Depending upon what we suspect, we will compare the readings in the vertical, horizontal and/or axial direction. What we are actually analysing is the dynamic motion of the machine. The forces due to mass imbalance cause the machine to move a certain way. A misaligned shaft causes a machine to move a different way. The same is true for a number of other conditions. So we use phase to detect the telltale movements. (It is also worth commenting that some faults do not generate characteristic forces, thus the phase readings do not provide a clear picture of the dynamic movement of the machine – however, this in itself provides a clue to the nature of the condition.)
Representing phase
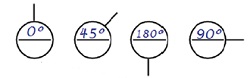
Rather than recording the phase readings numerically, we can record them visually. It can be difficult to look at a series of numbers and interpret the movement of the machine. However using graphical symbols makes this task easier. We can do this by drawing a circle and a tail at the desired angle, it is easy to quickly determine the angle with a quick glance, as shown in Figure 1.
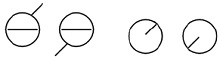
You don’t even need to write down the phase angle – you can just draw the tails; either inside or outside the circle, as shown in Figure 2. You can easily see that these two readings are 180° out of phase. (Often the angle is written above the horizontal line and the amplitude is written below the line, or vice-versa.)
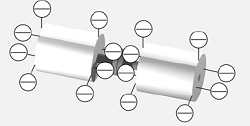
This data can be used in a number of ways, but one common method is called the bubble diagram (developed by Ralph T. Buscarello), as illustrated in Figure 3. You can take readings around the machine and enter them into the diagram, adding the tails according to the angle.
Precautions when utilising phase data
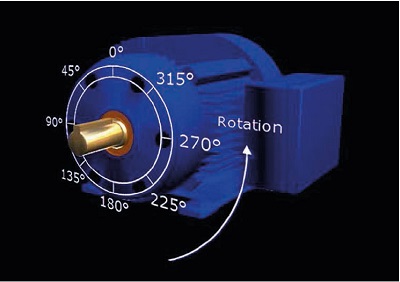
Care is needed when comparing phase readings taken at opposite ends of a machine, or when comparing phase readings taken across a coupling. Phase readings are sensitive to direction. Therefore 180° must be added to readings if the accelerometer is turned 180°. You must also be familiar with the phase convention used by your data collector. Figure 4 illustrates one such convention.
Also note that when we talk about the phase relationships between certain points on a machine we may quote that the phase readings should be in-phase, 90° or 180° out of phase. These are only approximate values. The actual readings may be up to 30° higher or lower and the rule still holds. For example, if the difference between two readings was between 150° and 210°, then you can consider the readings to be 180° out-of-phase. Also, if the difference between two readings is approximately 270°, then that is equivalent to a 90° phase difference. Likewise the phase difference of -180° is equivalent to a 180° phase difference. It all depends upon the direction of rotation, the setup of the data collector, and the convention used by the data collector.
DIAGNOSING FAULT CONDITIONS WITH PHASE
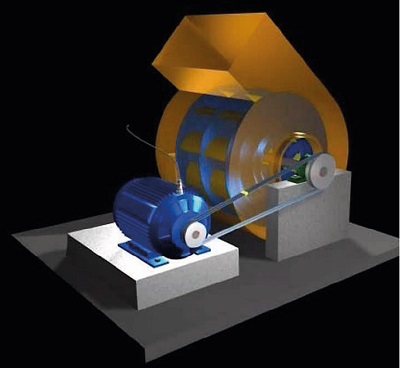
Fully explaining all the amplitude and phase relationships involved in diagnosing all fault conditions, or showing all the sample bubble diagrams, would need more space than is available here. So we will use a sample machine, as shown in Figure 5, to look at how phase readings can help us to diagnose fault conditions .
We can take a number of measurements in order to understand the motion of the machine. We can take readings vertically and horizontally at each end of the component. We can compare the amplitude and phase of vertical versus horizontal; we can compare the vertical readings at both ends of the component, and we can compare the horizontal readings at both ends of the component. For coupled machines, we can also take phase readings on either side of the coupling and compare the readings.
Axial readings are also very important. Rather than a single reading, we can take readings on either side of the shaft; to compare the left side to the right side, and compare the top to the bottom reading. And again we can compare axial readings taken on either side of the coupling (for example on the motor and pump).
You might routinely collect a single axial vibration reading, but when you are collecting phase readings it is important to collect two axial readings and, in certain cases that we will discuss later, you may even collect four readings. Due to restricted access, safety issues, and machine construction, you may only be able to take axial measurements at one end of the machine.
DIAGNOSING IMBALANCE
Although considered by some to be the most common and simplest fault to diagnose, it is actually quite easy to confuse imbalance with other fault conditions. If you find a high 1X peak and assume it needs to be balanced, you may be quite wrong – and generate a lot of unnecessary work – and still not correct the fault. You need to go back and study the motion of a rotor when it is not balanced correctly. If you understand the underlying motion you will be able to use phase data to prove that the rotor is in fact out of balance, and rule out other possibilities.
We will now review the different forms of imbalance, and then look at how we can analyse the end-to-end phase readings and the vertical-to-horizontal phase readings (relative amplitude values are also very useful, but that is beyond the scope of this paper).
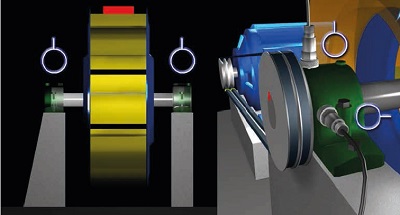
Static imbalance
The simplest type of imbalance is equivalent to a heavy spot at a single point in the rotor. This is called a static imbalance because it will show up even if the rotor is not turning – if placed in frictionless bearings the rotor will turn so the heavy spot is at the lowest position. We would expect that the motion at the two ends of the component would be in-phase (that is, the two vertical readings would be in phase, and the two horizontal readings would be in phase). Due to the circular motion, we would also expect that the phase angle between the vertical and horizontal axis would be approximately 90°, as illustrated in Figure 6.
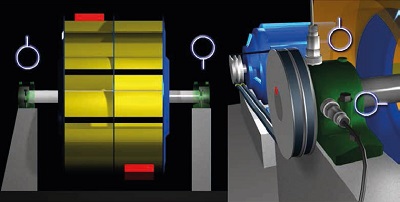
Figure 7: Phase relationship for couple imbalance
Couple imbalance
A rotor with couple imbalance may be statically balanced (it may seem to be perfectly balanced if placed in frictionless bearings), but when rotated, it will produce centrifugal forces on the bearings, and they will be of opposite phase. The phase angle between two vertical readings (taken from each end of the component) will therefore be similar to the phase angle between the two horizontal readings; approximately 180°, as shown in Figure 7.
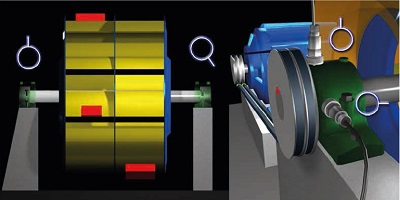
Dynamic imbalance
In reality, the amount of imbalance will not be evenly distributed along the rotor (unless it is a very narrow rotor or axial fan, in which case it will approximate static imbalance). We are likely to have a combination of static and couple imbalance, as illustrated in Figure 8. The combination is called dynamic imbalance.
Vertical machines and overhung machines
Phase readings can also help us to diagnose imbalance in vertical machines and overhung machines. Vertical machines, such as vertical pumps, are usually cantilevered from their foundation, and they usually show maximum vibration levels (at the running speed) at the free end of the motor regardless of which component is actually out of balance. Phase readings collected along the machine should be in-phase. Because of the circular motion that results from imbalance, the phase readings taken 90° around from the reference measurements should be 90° higher or lower; depending upon the direction of rotation.
The dynamics of an overhung machine are quite different; therefore our study of relative vibration levels and phase readings is quite different. Overhung pumps and fans are common in industry so you must examine the machine closely to ensure that you know whether a component is in fact overhung or supported on both sides by bearings.
The phase readings will be in-phase in the axial direction, as shown in Figure 9. Because of the bending motion there will be between 0° and 180° difference between the two horizontal readings, likewise between the vertical readings. The phase difference between the vertical readings will be similar to the phase difference between the two horizontal readings. And because of the circular motion, there will be approximately 90° between the vertical and horizontal readings.
MISALIGNMENT
Misalignment is very common. It can be difficult, however, to detect misalignment by measuring vibration spectra alone. Misalignment can be easily confused with other fault conditions, including imbalance and looseness. Phase analysis is a great aid.
When a machine is misaligned there are characteristic forces at play in proportion to the degree of offset and angle between the “rotational centrelines” of the shafts. These forces are very different from those observed when a machine is poorly balanced; so the phase relationships are quite different. If you suspect imbalance or misalignment, and you perform the tests described in the previous section and find that the rules are not met (for example, the phase angle between the vertical and horizontal axes is not between 110° and 70°), then there is a very good chance that the machine is misaligned.
(1) The phase relationship between the vertical and horizontal readings taken at the ends of the machine will not follow the rules that we described with imbalance. Due to the motion created with angular and offset misalignment, and the effect that different coupling types will have on that motion, the phase angle between the ends of the machine will not be consistent in the vertical and horizontal directions.
(2) If a machine is misaligned, we would not expect to see 90° difference between the vertical and horizontal readings taken at the same bearing. Instead they are likely to be closer to 0° or 180°.
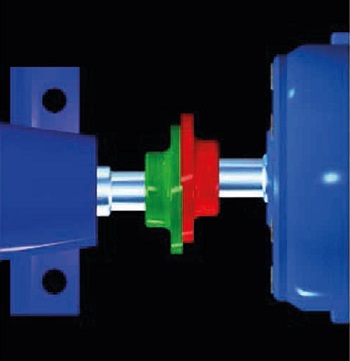
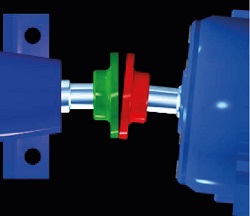
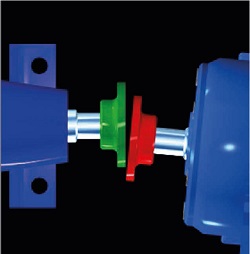
When there is strong angular misalignment you would expect the phase readings to be 180 out-of-phase across the coupling.
When you compare the phase readings from each side of the shaft (e.g. on the left and right side of the shaft, taken on the face of the component), things can get a little interesting. If the readings across the coupling (from one machine component to the other) should be out-of-phase, then you would expect a consistent phase relationship around the shaft – in order to maintain the cross-coupling relationship. However, because of the type of coupling, the design of the two machine components, and the actual balance of angular misalignment and angular misalignment, the phase readings may surprise you. On one component the readings may be in-phase, but on the other they may be out-of-phase.
ECCENTRICITY
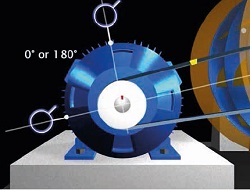
Eccentricity occurs when the centre of rotation is offset from the geometric centreline of a sheave (pulley), gear, bearing, or rotor. The highest vibration will be in the axis of the belt, so measurements should be taken in this direction, as shown in Figure 13. There will be a phase difference of 0° or 180° between the measurement taken in the axis of the belt and at right angles to that direction. Note that we are not taking phase measurements in the true vertical and horizontal directions. We are taking one measurement in line with the belts, and the other at right-angle to this direction.
BENT SHAFT
A bent shaft predominantly causes high 1X axial vibration. The dominant vibration is normally at 1X if the bend is near the centre of the shaft. However, you will see 2X vibration if the bend is closer to the coupling. Vertical and horizontal measurements will also often reveal peaks at 1X and 2X. However, the key is the axial measurement. Phase is also a good test used to diagnose a bent shaft. The phase at 1X measured in the axial directions at opposite ends of the component will be 180° out of phase.
It is also possible to take phase readings around the shaft – on both sides of the shaft, and above and below, as illustrated in Figure 14. We expect all of the readings to be in-phase.
COCKED BEARING
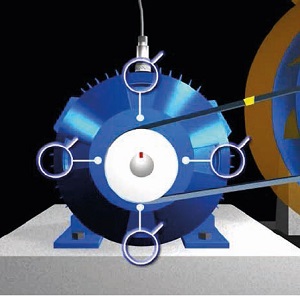
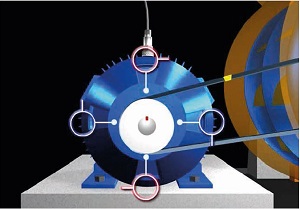
A cocked bearing, which is a form of misalignment, will generate considerable axial vibration, which can be confused with misalignment and other conditions. There are actually two possible forms of cocked bearing. If the outer race of the bearing is cocked, the axial phase readings will indicate a 180° difference from one side of the shaft to the other. However, it all depends how it is cocked. The 180° difference may be seen from the left side to the right or it may be seen from the top to the bottom – but not both.
If the inner race is cocked on the shaft, then the bearing will appear to “wobble” as it rotates, generating a rotating 180° phase difference. There will be 90° difference as you move from top to right to bottom, to left (or 12:00 to 3:00 to 6:00 to 9:00). The phase relationships are illustrated in Figure 15.
LOOSENESS
Phase analysis can also be used to help to identify looseness and foundation problems – but in a slightly different way. First, because rotating looseness involves a 1X peak and harmonics, it can, in some cases, be confused with misalignment and even bent shaft and cocked bearing. However, the phase readings will not follow the rules we have discussed thus far, and will be random in nature (erratic). So this can help you distinguish between the two fault conditions.
In the case of structural looseness, where there is a problem with the foundations, phase can be used in two ways. Firstly, if the vibration levels are high enough, the machine may rock back and forth. Phase readings taken in the horizontal direction could be in phase, but unlike imbalance, there will not be a 90º phase difference between vertical and horizontal.
Secondly, if there is a crack in the foundation or a loose hold-down bolt, you can monitor the phase while you move the accelerometer from point to point. When the accelerometer moves across the crack or loose boundary, the phase angle will change by approximately 180º.
CONCLUSION
Phase can be used to help the positive diagnosis of a wide range of fault conditions. If you have a two channel data collector, phase readings are not difficult to collect and should be performed frequently.
AUTHORS’ CONTACT DETAILS
Dean Whittle,
Reliability Maintenance Solutions Ltd,
No 42 Goldcrest Close,
Longridge Park,
Colchester,
Essex CO4 3FN. United Kingdom.
Tel: Fax: +44 (0)1206 791917;
Web: www.rms-training.com
Jason Tranter,
Mobius Institute,
280 Myers Road,
Merricks North,
Victoria, 3926. Australia.
Tel: +61 3 5989 7285;
Fax: +61 3 5989 7393;
Email: jason@iLearnInteractive.com
Web: www.iLearninteractive.com