

ABSTRACT
A reliability growth model is traditionally used to predict, from the history of a system’s failures, when failures of that system will occur. Typically, the system is physical asset (a machine or an equipment item), but it can also be a business or an organisation (a production line, or a railway line). Here, the widely used Crow-AMSAA model is used to examine the incidence of major accidents in an underground coal mining company.
August 2014 was the twentieth anniversary of the Moura No. 2 underground mine explosion, the third underground coal mine disaster in the Moura region of central Queensland, Australia. Mining started in the area around 1960. In 1962 the Thiess Peabody Mitsui Coal Pty Ltd joint venture company was formed to operate the Queensland Kianga and Moura mines and to export coking coal to Japan. BHP acquired Peabody Coal’s Australian assets in 1976-77, and gained a 60 percent stake in the Moura and Kianga coal mines. In 1985 BHP increased to more than 80 percent its holding in the operation of the Moura and Kianga mines, Thiess Dampier Mitsui.
On the 20th of September 1975, at Kianga mine, 13 miners died from a spontaneous combustion methane explosion. On the 16th of July 1986 12 miners died at Moura No. 4 mine from a suspected methane explosion. Just before midnight on Sunday the 7th of August 1994 there occurred the first of two explosions in Moura No. 2 underground mine which killed, 11 men. Within less than twenty years 36 men had died from underground explosions in these operations. Underground mining ceased after 1994 and only open-cut mining has continued ever since.
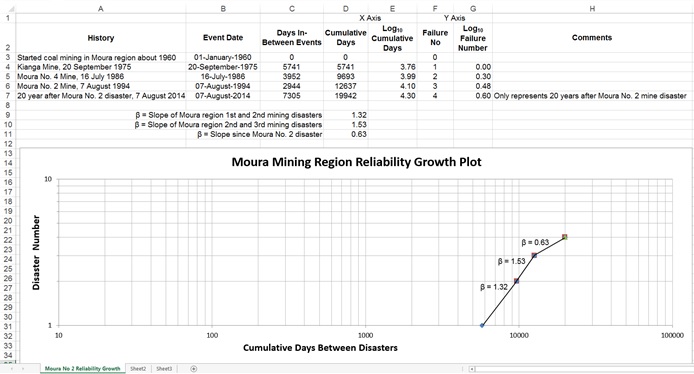
We decided to see what could be gleaned from the log10-log10 plot of these ‘failure’ data that can be derived by applying the Crow-AMSAA model of reliability growth to them. The data and plot are shown below.
A reliability growth model is traditionally used to predict, from the history of a system’s failure events (i.e. those that have already occurred) when failure events will occur to that system. Typically, the system is a machine or an equipment item. But it does not need to be a physical asset. A system can also be a business or an organisation. It can be a production line, or a railway line.
What matters is that the behaviour of the system follows a log10-log10 power law. Normally, you confirm whether historic data follows a log10-log10 power law by plotting each individual event point on log10-log10 axes and seeing if the set of historic points form a straight line. The proximity of the points to a straight line indicates goodness-of-fit for the data points. When a reliability growth model has many data points, the goodness-of-fit to a straight line gives confidence that the system behaviour can be represented by a log10-log10 graph. It is then reasonable to deduce that because the past events fall in a straight line, then by extending the line into the future you can estimate the future events. It is possible that curvature and discontinuities are observed, but these are all part of the behaviour of the system and its processes being monitored. As the modelled system’s reliability changes, one expects a bend or corner to appear on the graph at the point in time a change is made to the system. From this time, a new straight line representing the future progress of the changed system is fitted to the system reliability model.
There have been times when a Crow-AMSAA model has forecast future events so accurately, it was a prediction. (When that happens, it gives you the shivers, and the hairs on the back of your neck stand out straight). That is not so in the Crow-AMSAA plot shown here. Each point plotted in the chart is one of the three mining disasters (the fourth point is not a disaster; it is simply today’s date used as a reference date). If they did form a straight line the conclusion would be that the ‘system’ behaviour was unchanged during the two decade time period covering the three mining disasters. But we are looking to see if the system behaviour did change between one point and the next. We want to measure the slope of the line between each point to check if there was system reliability improvement, or the system performance was stable, or it was worsening. In developing a Crow-AMSAA plot using few points, you make the assumption that a log10-log10 power law applies to the small amount of available data. If it is a wrong assumption you will get meaningless forecasts and not know that they are not believable.
When log10-log10 power law behaviour occurs, it implies particular conditions. It reflects the presence of risks occurring within the system. The frequency of the failure events is not purely random but is being produced by the system itself. The slope of the line, known as its Beta value, is indicative of the effort being made to make changes to the system’s reliability. It can be said that the Moura region underground mining ‘system’ disasters were outcomes of the sum of the effects of all the various processes used in the mines.
The Beta values in the plot also have significance. A Beta of one means the frequency of events is constant. Beta less than one means reliability is improving, and more than one it is worsening. In the Moura area plot the Beta values during the two decades when the disasters occurred are more than one. One can begin to draw the conclusion that many risks existed and on three occasions their combination unfortunately ended in disaster. Since 1994 the underground mining stopped and only open cut mining continued. The bend in the plot and the low Beta slope value tell us that the accumulated effects of the changes made in 1994 have made the Moura area mines much safer places.
CONCLUSIONS
You can model your own failure and safety data using a Crow-AMSAA reliability growth model to give you fresh and profound insights into what is happening to the failure and safety processes in your operation. The Crow-AMSAA reliability growth analysis and plot shown above were developed using spread sheet methodology developed in the author’s company. Information on this and articles and white papers on Crow-AMSAA analysis are available via lifetime-reliability.com
To contact the author, email
mike@lifetime-reliability.com