

Peter Willmott, Associate Partner, SA Partners

ABSTRACT
In the first of a series of three, this article explores some of the myths and realities about the central performance metric of TPM called Overall Equipment Effectiveness (OEE). It includes the solid and proven idea of a tiered three-level “Site Performance Contract”, whereby responsibility and accountability can be aligned to the right action level in the organisational structure to deliver sustainable improvement in the supply chain.
The first level is the top down, target driven Leadership tier – which we call “Supply Chain Effectiveness”. The middle tier is the Management tier – referred to as “Door to Door Effectiveness”. A bottom up third tier called “Floor to Floor Effectiveness” focuses on the OEE’s six classic equipment-based losses for the shift-based teams of operator and maintainers.
By taking this cascaded three-level approach it is possible to clearly allocate the responsibility for driving out waste in all its forms. While the pinch point or weakest link in the supply chain is often equipment-related, there is little merit in improving flow by attacking the classic six equipment losses if the upstream inflows and downstream outflow losses to that specific equipment are inhibiting the total value stream flow.
- Maintenance as a core value-adding activity.
Before starting to dig deeper into the OEE part of the TPM philosophy and enabling tool, it is worthwhile taking stock.
One of biggest problems still facing many of today’s maintenance functions – and hence its managers and professionals – is one of poor image and perception as being an unnecessary cost burden rather than a core value adding business priority.
Why is there this poor perception? It may be because the engineering director has never sat down with the maintenance manager and thought long and hard enough about:
• who is the internal customer?
• who are the key influencers, both positive and negative ones?
• how should we go about changing the existing poor perceptions?
The first two questions are relatively easy to answer.
The customer is Production or Manufacturing or Service Utility provider and the key influencers are the ultimate sponsors – the production director and the finance director, and ultimately the managing director.
The essential first step to change these perceptions is for the maintenance function itself to reflect and define its own purpose and objectives, and hence its contribution to the business drivers of the particular facility within that plant’s Operational Excellence journey (and hence business transformation intentions).
These outputs then need to be clearly articulated to the above three key “Influencers” – not just in terms of maintenance efficiency (cost down) but more importantly, maintenance effectiveness: what it can achieve via the elimination of waste in all its forms. Typically this means the OEE’s classic six equipment-based losses, plus the energy, environment and safety performance of the business. This can only be achieved by aligning maintenance’s contribution to the company’s Operational Excellence Model as a value adding activity, and not simply as an unnecessary cost burden which is an easy target to reduce at the annual budget formulation time.
One way of visualising maintenance’s potential contribution as a value-adding activity is to use the analogy of the iceberg, where the tip of the iceberg is the visible direct cost of maintenance to the business via the annual maintenance revenue budget, as illustrated in figures 1 and 2.
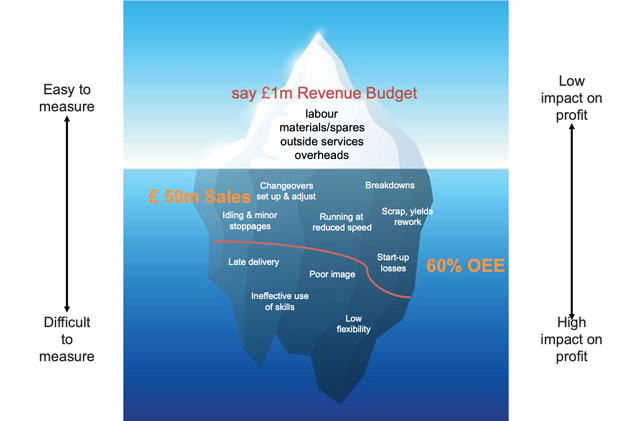
In this simple example consider a business which has an annual maintenance revenue budget of £1m (which we will call “direct cost of maintenance” – DCoM) which is supporting £50m annual sales, but only with a site average OEE of 60%.
The challenge is set to increase the site OEE to 72% through the implementation of a targeted and effective TPM programme without increasing maintenance expenditure. Those 12 percentage points on a base of 60% are equivalent to a 20% real increase in productive capacity, and because the additional output can be sold this becomes a growth scenario rather than cost-down. Annual sales become £60m, and the additional margin on those sales will be worth £1m to the business as illustrated.
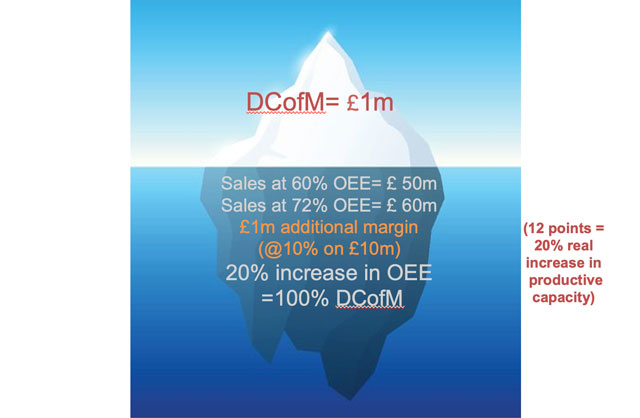
In this example a 20% increase in productive and saleable capacity is equivalent to 100% of the annual maintenance revenue spending. So the message is: stop hacking away at the tip of your iceberg every year at budget time and instead concentrate on the less visible opportunities for waste elimination below the surface.
The key point is that you can be apparently very efficient in your maintenance revenue budget and spending (tip of the iceberg cost management) but this can be totally ineffective (below the waterline) in its relevance to the business drivers, where waste elimination should be top of the agenda. A maintenance manager has to be excellent at both.
2.Six common myths about overall equipment effectiveness
There are a number of misconceptions, misunderstandings and misinterpretations of how to apply and use OEE as a key performance indicator of the true productivity of physical manufacturing assets and production processes.
Before looking at the six myths it is worthwhile exploring the OEE concept in a little more detail.
Overall Equipment Effectiveness is a measure of availability multiplied by the performance rate of the equipment when running and the quality rate that the equipment is producing. Negative effects that militate against this being as high as it should be are six classic unplanned events or non-conformity such as:
• breakdowns
• excessive changeovers and set up times
• running at a reduced speed because the equipment is not quite right
• minor stoppages, which do not need a maintainer to attend the machine but cause the operator to have to intervene because of, for example, a jam or blockage
• scrap, poor yield or rework and quality problems
• start-up losses every time an unplanned stoppage or changeover occurs.
The first two losses affect the availability of the asset or machine: the second two the performance rate when running and the final two the quality rate.
The above are referred to as the six classic equipment-based losses and are often described as Floor to Floor Losses (F2F), whereby a product (or material) is picked up and processed through a machine before being placed on a pallet or conveyor for onward processing or stores/assembly.
The OEE is a vital measure, as it is in effect a measure of equipment-based waste in all its forms. The TPM System drives toward a high OEE and being in control of the process through focused improvement, resulting in a trouble-free shift where people are working smarter, and not harder.
A further important point to stress is one of targeting an improvement in the OEE.
Referring to figure 3 below, if for example analysis of data shows a current OEE of 45% based on the average of the last four weeks, and the perceived wisdom of management is that it should be a “world class” level of 85%, that represents an 89% real improvement in productive capacity (85-45/45 = 40/45 = 89%). Operators and maintainers will not accept that such an improvement target is realistic.
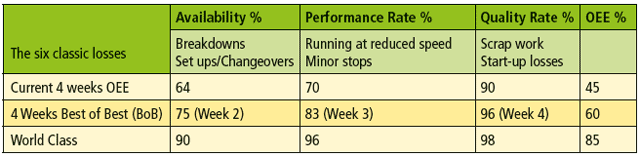
If, however, you examine the data that has arrived at the 45% OEE average over the four weeks and see what is the best availability, performance and quality achieved in any particular week, and multiply those three figures together, the notion of an initial target based on a “Best of Best” achievement of 60% becomes believable. Why is this the case? If you can get control of the six losses (rather than eliminate them), the BoB will be hit consistently week by week, and in doing so a new BoB will be created, getting nearer to that world class level of 85%
Myth No 1: An Overall Equipment Effectiveness level of 85% is “world class”
It certainly is not if you are running, say, a flour mill or an offshore oil platform. In these cases if you’re not hitting 90%-plus OEE then you’ll soon be out of business.
85% may be world class for a typical machining centre that has a significant number of changeovers, but it is no Golden Goal.
It is necessary to look inside the OEE and determine the world-class levels of the three elements of availability, performance rate when running and quality rate produced, then multiply the three figures together to determine your world class target OEE.
Depending on your industry, the ultimate world-class target might be:
Packing Line: 80% × 96% × 97% = 75%
Flour Mill 98% × 99% × 99% = 96%
Bottling Plant 85% × 98% × 96% = 80%
Machining Centre 90% × 96% × 99% = 85%
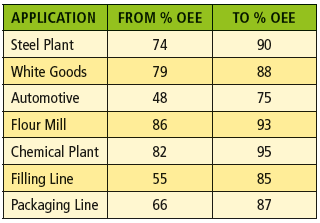
What can a TPM driven approach achieve in improved overall equipment effectiveness?
Some examples are given in the table below.
Myth No 2: OEE is a management tool to use as a benchmark and comparator
This misses the point of the OEE, which is a manufacturing floor problem-solving tool.
If, however, management insists on benchmarking, then beware of not comparing like with like. There are also five questions to answer:
• What is the impact of the number and variety of product changeovers?
• Who sets the standards for performance rates when running: production planning, equipment supplier or engineering?
• How big an impact do manning levels and skill levels have on cycle time?
• Are all minor stoppages recorded?
• Are you measuring all aspects of quality including packaging materials?
Myth No3: OEE should be calculated automatically by computer
The computation approach is far less important than the interpretation. While initially calculating manually or inputting manually, you can be asking why has this result or unplanned event occurred? Once you’ve proven the manual measurement process, then mechanise it.
Myth No 4: OEE on non-bottleneck equipment is unimportant
OEE provides a route to guide problem-solving.
he main requirement is for an objective measure of hidden losses, even on equipment elsewhere in the chain, especially if it is generating controllable waste or non-value adding.
Myth No 5: We don’t need any more output, so why raise the OEE?
Management’s job is to maximise the value generated from the company’s assets. This includes business development. Accepting a low OEE defies commercial common sense. If you are able to increase the OEE from, say, 60% to 80% by tackling the relevant six losses, you will have increased the productive capacity of that asset by 33%. This means you can produce the same output in two-thirds of the current time, or make 33% more in the same time. Both give you flexibility at 80% OEE that you did not enjoy at 60%.
Myth No 6: OEE is not useful because it doesn’t consider planned utilisation losses or labour co-ordination/diversion losses and material supply starvation losses
The OEE is one measure, but not the only one used. Others will include productivity, cost, quality, delivery, safety, morale and environment. Often these Door to Door or management losses (as opposed to equipment-based Floor to Floor losses) are vitally important.
There is no “one size fits all” approach to OEE.The challenge is to adapt OEE to your business. What you must not do, however, is corrupt it so it becomes unrecognisable and fails to point you at the problems, and hence opportunities to improve.
- The Three-Tier model
In the book TPM – a foundation of Operational Excellence [1] I and my co-authors explore in some detail seven different manufacturing and process utility types comprising
• Process/bulk manufacturing (capital intense)
• Classic manufacturing (cell and/or linked assets)
• Packaging (often labour intense and with partial automation)
• Assembly (again sometimes labour intense but most likely highly automated)
• Utilities and general services (often capital intense)
• Warehousing (pick and place and automation)
• Remote and dispersed assets (wind farms, phone masts, water reservoirs)
This article will take a closer look at assembly processes. This could be a stationary but complex physical asset into which are fed several components, often at high speed, using innovative and ingenious tracking, sequencing, insert and pressing devices with high levels of automation.
Alternatively, it might comprise a moving line or pulse line assembly for larger, more complex products (such as home entertainment goods, white goods and vehicles). The human/machine interface and interaction may be more labour controlled than machine controlled.
In both cases internal and external supply chain co-ordination will be crucial. Also the resultant internal pre-kitting, Kanban and line balancing will be just as important as the equipment reliability issues themselves.
This is where a broader view of the OEE is worth exploring, as in Figure 4.
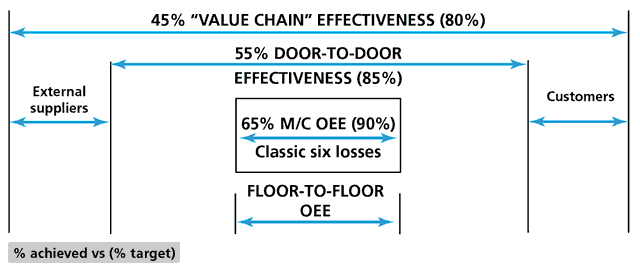
• The Floor to Floor OEE, which focuses the core team’s TPM efforts on the six equipment-based losses (breakdowns, changeover times, running at reduced speed, minor stops, scrap/yield/rework losses, plus start-up losses). This is where a product or raw material is fed to a value-adding machine, physical asset or process and then placed on a pallet or conveyor for onward routing.
• The Door to Door effectiveness, which is within management’s control (and is not an equipment-related loss). Typically these losses might be:
· Labour co-ordination losses (such as no operator available, or the maintainer is diverted to other priorities)
· Product supply starvation
· No work order
· No packaging materials
· Consumable stock-outs
· Awaiting QA clearance instructions
· New product introduction trials
· Machine upgrade, and hence out of production service.
• The Value Chain effectiveness, embracing suppliers through to delivery to customers.
In the example in Figure 4, the current and target levels of effectiveness (in brackets) are shown at each level.
There is little merit in increasing the F2F OEE from 65% to 90% if the D2D effectiveness stays at 55%. Likewise there is little merit in getting the D2D effectiveness up to say 85% if supplier responses are inconsistent and product is being made that stands in the finished goods warehouse for six months. The point is that concentrating on the F2F losses will also highlight the D2D losses and in turn the supply chain effectiveness.
This three-tier approach can then be aligned to the specific plant organisation structure to reflect precise responsibilities, accountabilities and expectations at each of the three levels to identify and drive out non-value added losses as a site performance contract, as illustrated in figure 5 below:
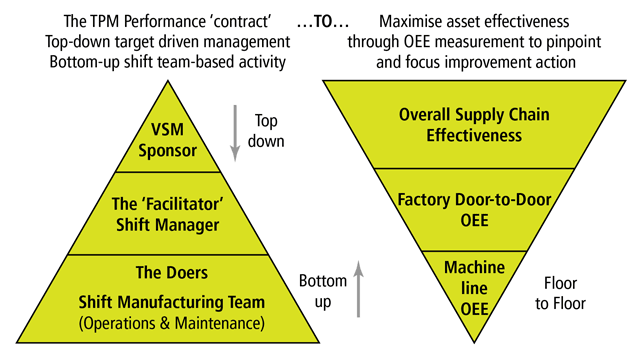
This approach allows commitment and accountability to be pinpointed at the right level in a plant’s organisational structure such that, in this example:
• The general manager (or value stream manager) is the sponsor of the TPM routines (making TPM a non-optional part of ‘the way we do things here’)
• The unit operations shift manager, through their shift based section leaders, are the facilitators of the TPM routines (ensuring that the routines are carried out to the required standard at the right time and frequency, and are therefore an essential part of standard work).
• The operators and maintainers, who carry out the TPM routines that they themselves have designed and specified during the TPM pilot project phase.
All the above becomes a key part of the application of standard work which will be central to the TPM activity.
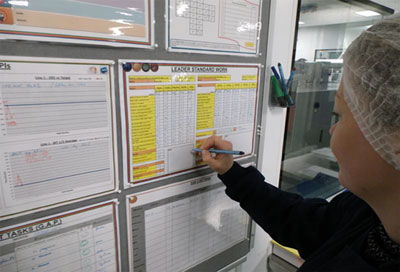
Standard Work is a detailed definition of the most efficient method to produce a product (or perform a service) as a series of specific work tasks to achieve a desired output rate. This is achieved by breaking down the work content into elements, which are sequentially organised and repeatedly followed. It is often presented in the form of standard operating procedures as a series of highly visual single point lessons linked to a training accreditation/tracking process.
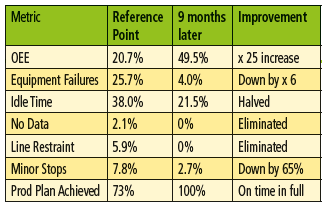
This approach to implementing a wider perspective of OEE can yield these results for a value stream with critical pinch point physical assets. In the short term:
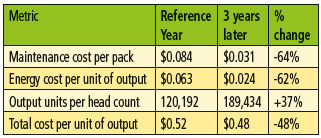
And in the longer term for the complete site:
All the above becomes a key part of the application of Standard Work which must be central to the TPM activity.
Ultimately it is the site leadership team who develop the right culture by undertaking the right activity in the right style by understanding the roles and responsibilities at all levels in the site organisation. This will only happen by recognising all employees’ contribution to success and identifying coaching and development opportunities so that the whole organisation engages in continuous improvement activity. The OEE is a powerful enabler to ensure those employees become more readily involved to improve the likelihood of a successful and sustainable transition and outcome.
References
TPM – a foundation of operational excellence. Peter Willmott, John Quirke and Andy Brunskill. Published by SA Partners, 2019. ISBN 978-1-9993748-1-5. £39.99 with a £2 donation shared between Friends of Chernobyl’s Children and The Prince’s Trust for each copy sold.