


ABSTRACT
With each regulatory review cycle, water utilities are put under increasing pressure to do more for less. This is a challenge embraced enthusiastically by the sector. Producing wholesome drinking water and treating waste are a given; supporting local communities, enhancing the environment and driving a carbon neutral agenda are expected value-added activities. This all comes at a cost; however, customers and investors expect competitive pricing and returns.
Most production companies do not budget for equipment failure (and its indirect costs). Over time, the annual budget process and drive to improve efficiency can result in pressure being applied to direct cost plans which can reduce proactive maintenance activity. In turn, if not managed correctly, this can lead to an increase in indirect costs and consequences.
Utilities are just another production environment and should look to the wider production world for best practice to achieve their goals and objectives. Overall Equipment Effectiveness (OEE) is key to releasing value, by improving asset availability, and driving up performance through reducing the cost of production, while improving product quality. An OEE mindset and approach explores the cost and value streams to ensure the right maintenance strategy is applied and OEE optimised.
OEE has been successfully applied in both asset investment and asset care thinking in Severn Trent Water, balancing and optimising the OEE elements of availability, productivity and quality to reduce the capital and operational cost burden, extend asset life, and achieve desired performance outcomes.
The challenge
As with many operational environments, efficiency challenges drive an inadvertent cost grind. From a maintenance perspective this often results in a move away from proactive or pre-emptive care towards failure response. Neither extreme is optimal, and the effects of such decisions are not always felt immediately, leading to complex and costly root cause analysis and recovery.
Utilities have a vast and complex asset base comprising legacy assets, originally engineered with levels of redundancy or duplication, through to the latest right-sized technology. The legacy of redundancy has meant that the adoption of leading asset care and maintenance approaches has not always been required, leaving a predominantly reactive stance and immature maintenance strategy when compared with other production environments.
A regulated business is driven by regular incentives defining outcomes; utilities can find themselves focusing on the outcomes in the broader context and not on the asset performance that drives the outcomes, often reacting to events or incidents.
Severn Trent Water decided to adopt the principles of Overall Equipment Effectiveness, a strategy and philosophy more usually associated with manufacturing production. In effect the aim was to consider Severn Trent’s operations as a series of factories.
As a result, there are now three major aspects in play in Severn Trent’s approach to asset maintenance, all of which use OEE as a basis for decision-making:
- Optimisation of existing assets
- Asset Investment
- Asset Care – maintenance
Overall Equipment Effectiveness
OEE is a well-known performance measure supporting Total Productive Maintenance (TPM), a strategy utilised successfully in many top performing production companies. OEE is expressed as a percentage and is the product of three key elements (Figure 1).

The three elements are not mutually exclusive: doing something to affect one element may affect the other two elements.
Understanding OEE allows the asset manager to compare asset performance. Though care must be taken in comparing assets producing different products, OEE can be used to compare assets operating in the same production environment in the same operational context.
An asset, site or factory’s desired OEE is defined through the design and build process, and its actual OEE is set at the time of commissioning and setting to work. The design process will have determined the target actual and the minimum acceptable OEE; the difference between designed and minimum acceptable is the OEE envelope. OEE allows an asset manager to track performance deterioration, helping to trigger intervention either to sustain OEE performance within this envelope, or return performance into the desired OEE envelope should it deteriorate below the minimum.
In Severn Trent, available datasets have been aggregated and aligned according to the drivers of OEE. A dashboard has been developed that allows performance to be evaluated at all levels of the asset hierarchy: asset, process, site, control group. Severn Trent is at an early stage in the journey; asset managers are beginning to define operating envelope tolerances for specific assets and systems. Aggregation of data to monitor performance at all levels of the asset hierarchy allows asset managers to evaluate performance of a system over a geographical area: for example a distribution asset manager would be able to explore system change options rather than actions to improve a specific asset, leading to greater system resilience and improved overall OEE.
Figure 2 sets out the asset or system life cycle from identification of need, right through to decommissioning. Asset Investment & Optimisation, the first half of the cycle highlighted green, explores the need, defining the solution and requirement in terms of asset investment, answering the question of what is required to achieve the performance target, physically setting the OEE expectation. This is where the whole system is considered, and holistic decisions made. Asset Care, the second half of the cycle, is about how the asset is cared for, how it is operated and maintained to meet or beat the expected OEE performance or life expectancy, taking care this is not at the cost of optimised overall OEE. This is where care decisions are made at asset level.
Maintenance strategy and approach
Maintenance means the activities necessary to sustain an asset’s health. Asset health is measured by assessing the asset’s availability, productivity and product quality, which together make up the asset’s Overall Equipment Effectiveness. Conducting very comprehensive maintenance will result in high availability and high product quality but may reduce productivity. Carrying out no maintenance might keep productivity high but result in poor quality and low availability.
In a water utility it is easy to confuse product quality and quality outcomes, because everything a water utility does is about producing wholesome water and treating waste. In the OEE context, quality can be defined as a consistent product, consistently meeting the quality targets set, always available and with no waste. For wastewater it means taking away sewage from customers, keeping it in the pipe until treated and safely returned to the watercourse, with sludge, grit and rag waste managed appropriately.
The objective of a maintenance strategy is to strike the right balance for each asset. A maintenance strategy is an important component of a company’s overall asset strategy.
The most successful organisations adopt and develop industry best practice. A best practice maintenance strategy will have all the following:
- An understanding of existing levels of maintenance maturity
- Defined measures of asset health
- A maintenance care register
- Continual evaluation of care packages
- A working operational delivery mechanism
- Asset care records.
This will be backed up by good quality asset data and performance information, which is essential to support the decision-making processes. The more advanced the maintenance strategy, the greater the need for precision. However, progress should not be stalled while seeking data utopia. There are always opportunities to infer data and use uncertainty techniques to inform good decisions.
Types of asset care approach
Once asset health measurement is established, the best asset care approach must be selected for each asset type. There are five broad types of asset care approach. These methods are split into proactive and reactive categories as shown in figure 3.
a. Time (proactive) – Renewal, refurbishment or care intervention is on a time-based cycle, either calendar or hours run, usually with physical intervention to replace components or undertake service activity. The intervention period is set at less than mean time to failure (MTTF).
b. Condition (proactive) – Intervention is triggered by known performance or asset health, usually driven by non-intrusive inspection (inspection can be time-based) or monitoring. Triggers such as RCM inspection, online monitoring, and performance data or fixed equipment monitoring determine intervention before failure. The aim is to pre-empt breakdown far enough ahead to allow a planned response.
c. Component replacement (proactive) – Specific components of an asset are replaced based on an understanding of their criticality and failure modes. Replacement can be either time-based or condition based.
d. Planned (reactive) – Response to failure has been planned, usually based on cost of failure; response requirements have been thought about and spares, resources and methods planned. Usually adopted for low-risk assets with low cost of failure or consequential damage. Readily available spares and materials and installed redundant capacity can mean this approach can be more cost-effective than proactive.
e. Unplanned (reactive) – Emergency activity. There is no time to plan a response; this is usually triggered by an on-site alarm, or staff or customer observation. Risks have generally been transformed into issues. This is most likely to be applied where the consequence and cost of failure is negligible.
The use of OEE and more advanced analytics allows a broader and more mature maintenance approach to be adopted. Each approach has its own benefits case, based on cost, impact and failure pattern. It is important to ensure the right approach is selected, dependent on several factors, which include cost of failure, cost of care, asset redundancy, obsolescence, criticality, predictability and operational context. It may be necessary to develop bespoke rather than generic care approaches. Selecting the right approach considering the asset in the context of its operation is essential in optimising OEE.
As illustrated in Figure 2, asset management encompasses both asset investment and asset care. OEE is a measure to be used to support successful delivery of both. For investment OEE helps understand asset performance and hence investment prioritisation and requirement to sustain performance. For care OEE helps understand the day-to-day operational and maintenance intervention required. Holistically OEE helps understand the best action to sustain asset performance: either investment or care.
The Severn Trent approach to asset care
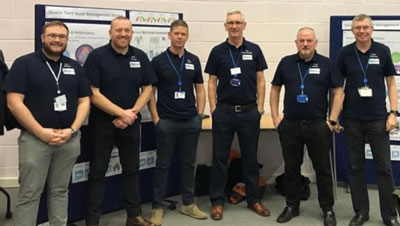
In 2017 a small team of operational engineers (Figure 4) was brought together and challenged to review how assets were being operated and maintained to improve operational performance. Initially the team focused on a couple of key asset types, exploring current performance, identifying potential gaps and implementing improvements through changes to asset care approach. It was clear improvement opportunities were available, but a structured approach with strategy and principles would be required to drive a continuous improvement process.
Around this time Severn Trent production had introduced core principles which included having a factory mindset and being more proactive. The team explored factory thinking and it was clear that Severn Trent could consider its operations as a factory. Each stage of its production was effectively a factory with its own inputs, outputs, constraints and resources, from the initial abstraction of raw water, transporting raw water to a storage facility, to storing and then treating the raw water to produce wholesome drinking water, and finally delivering the product to the customer. The same is true in reverse for the waste stream. Each part of the value chain is a factory producing a product to move on to the next factory (Figure 5).
Of course, there are thousands of “factories” at each point of the chain, each individual site a factory with individual performance expectations.
Severn Trent turned to manufacturing to explore what was available to support the mindset and principles. Looking closely at Overall Equipment Effectiveness, it realised there was a close relationship. Asset availability – assets being available to use when wanted; productivity – the assets running as efficiently as possible during operation; quality – the end product meeting the desired standard with no waste.
Next, the team considered the assessments it had carried out and realised the data collected and analysed from the initial studies were closely aligned to the elements of OEE. The team also started to explore the relationships between the OEE elements.
It was clear the OEE elements were not mutually exclusive. Any attempt to take action to improve one element was likely to have an impact on the others. This impact could be positive or negative, small or large, effectively suggesting a gearing relationship between the elements.
To improve asset performance, the whole OEE impact needs to be considered to achieve an optimised balance between the three OEE elements. For example, an action to improve availability may have a relatively small positive impact on productivity but could have a similar but negative impact on quality, overall resulting in a possible small improvement in OEE (Figure 6). The key is realising that no two assets have the same relationships or gearing between the elements.
Realising this relationship, it is easy to see how events and incidents that may focus on one dial, without considering the whole, could result in an overall reduction in OEE.
The team built this into its asset review methodology, together with well-known practices and theories such as Kanban, FMEA, maintenance maturity and the P-F curve, and produced a business process with OEE principles embedded in it (Figure 7).
Essentially, all asset care reviews are now conducted considering the current OEE performance and the potential impact of any recommendations. Each assessment includes a net benefit forecast which is tracked for benefits associated with each OEE element.The assessment process also includes a governance step to ensure all key stakeholders are happy to support it, and appropriate challenge is presented to the recommendations.
OEE mindset vs OEE measure
Some companies fail in implementation of OEE because they take it too literally, trying to define each element and achieving absolute measurement through quality data. If data quality is poor or poorly defined it could give an incorrect indication, and hence result in a sub-optimal outcome. Yet the principles and thinking are sound and can offer improvement from just applying the thinking logically. This is especially true where the gains are significant; however, good quality data will be required where the gains become marginal.
Introducing and embracing the OEE mindset first allows the principles and thinking to become embedded while the company works on improving data and hence measurement.
Asset assessment
As a result of the initiative, in STW a structured process has been adopted to identify opportunities, then systematically review them to release value by applying the best care approach. Assessments are based on a true understanding of desired, current and potential OEE, ensuring all elements are thoroughly explored.
Perhaps the most difficult element to measure accurately at asset level is productivity. Availability and quality are relatively easy by comparison, though all three are equally important in the assessment process, and the optimum balance is the target. As maintenance is often considered a cost burden, a clear productivity impact as part of the overall OEE impact is critical in the drive to change perception and to be able to articulate the value of maintenance: more on this later. Without a clear productivity impact it is difficult to secure approval for an improvement business case.
Focus on productivity
During an assessment, the cost of care and cost of failure are captured and plotted. The true cost and consequences of care and failure (including knock-on effects) are added together to give an overall cost and consequence (productivity) impact curve against all care approach options. The lowest overall cost and consequences indicate the approach that will optimise productivity. This is then considered together with availability and quality to ascertain the best approach to adopt.
It is essential to understand fully the productivity impact, especially the true cost of failure, which is often hidden and lost in company accounts and seldom attributed to a specific asset or event. This cost is essentially the productivity value available to be released if the business case supports a change in care approach (Figure 8).
Figure 8 is a simple illustration: it shows maintenance care approaches on the horizontal axis and cost and consequences on the vertical axis. Essentially this shows how important it is to understand true cost of care and failure when considering the productivity impact. Cost of failure can be difficult to ascertain; without it, the care strategy is driven to be reactive.
Moving from reactive to proactive
With good data and an OEE mindset, following a structured review process, it was possible for the team to demonstrate that moving from a reactive to a proactive maintenance approach could have a positive impact on all three OEE measures. Likewise, the approach confirmed that in some cases a reactive care strategy was the optimal care approach. This confirms that all care approaches are valid – the key is to select the best one to optimise OEE.
However, it was understood by the team that changing the care approach is not as simple as changing care schedules. Moving from reactive to proactive sometimes attracts a transitional cost – In other words, there is an establishment cost up front, then benefits are recovered later. Where change requires more field time to deliver, this can be tricky to achieve with fixed direct labour.
To facilitate the move from reactive to proactive, early in the process the team focused on releasing value, especially field staff time, to create capacity and space, and savings in operating expenditure. Releasing field staff time came from reducing non-value adding activity, questioning tasks and their frequencies to test whether they were adding value, and removing them if not.
Effectively the team started to build a record of value released, a bank balance of OEE impact, recording the net effect of the improvements made against the three OEE elements. This was subsequently drawn on to implement further improvement where an investment was required up front. This allowed more complex changes to the care approach, moving to proactive from reactive with the ability to absorb the initial “bow wave” of delayed return on the investment.
Asset assessment case study: rotating biological contactor (RBC)
A rotating biological contactor is a small sewage treatment package plant, consisting of a media pack mounted on a shaft supported at either end by bearings. The pack is driven at slow speed via a motor and gearbox (Figure 9).
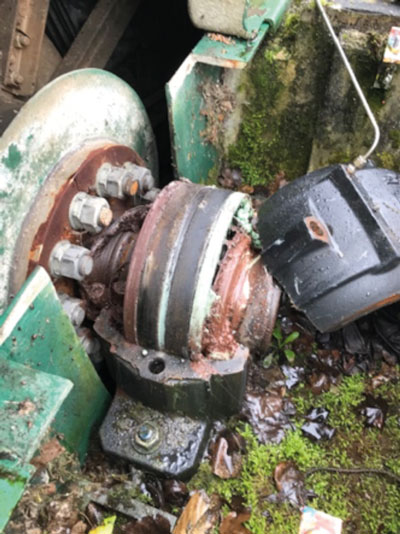
OEE was poor. There were many failure modes; however, failure mode and effects analysis showed shaft bearing failure was a key contributor. Shaft bearing failure would lead to consequential damage of other system components (Figure 10).
The OEE impact was as follows:
Availability
Asset unavailability was significant because of damage to ancillary components, components that would have not otherwise failed or needed attention. Lead time would be extended, the intervention would require more detailed planning and would need heavy plant to facilitate the repair, and increased manpower would be required. It was not uncommon that, for this failure mode, an RBC would be unavailable for 12 weeks.
Productivity
Cost of repair was greater than necessary because capex funding was required for the ancillary components. Opex would often be affected too, because of the need for operational workarounds such as diverting influent to an alternative treatment facility. Reactive failure would also affect field staff overtime because the event could occur at any time.
Quality
In some cases, where RBCs are single installations, there would be a risk of reduced treatment capacity, resulting in a sample failure or potential pollution event. Although in most cases mitigation is available, the mitigation has a further impact on productivity and the risk still exists.
An assessment resulted in two care approach recommendations: first to change bearings based on condition; second to improve regular lubrication practice.
Improvements were implemented and audited to check the forecast OEE improvements had been achieved. The outcome returned the following annual OEE benefits:
*655 days per year is across the whole installed base of RBCs.
Clearly the actual OEE impact would vary asset by asset: some failures do not cause consequential damage, and some RBCs are installed with redundancy. The figures above are the return for the asset base collectively over time showing a positive dial movement for availability, productivity and quality.
Reviews
In Severn Trent’s approach all asset types are periodically reviewed, to decide the appropriate maintenance maturity level and develop the correct care package and associated tasks. The objective of these reviews is to:
- Ensure the asset/component meets or beats its expected asset life
- Minimise cost and consequences of failure and cost of ownership
- Optimise asset health, availability, productivity and quality (ie strike the best OEE balance)
- Determine how maintenance activity should be delivered and whether it should be in-house and contracted out
- Keep up to date with Industry advances.
Critical to the success of these reviews is collaboration between key stakeholders across the business. A successful asset management function must pool knowledge and experience from all levels and avoid silo working. Severn Trent Water’s care package evaluation process and governance model engages all involved, supported by cross-functional management.
Demonstrating maintenance value
The principles and approaches described above rely on good quality data, and an understanding of how OEE informs performance improvement and how it is likely to be affected through a change of care approach. The benefit of such an approach is that it is based on understanding the cost and consequences of failure, and hence the maintenance value. Behind every change recommendation there is a strong business case which illustrates cost of non-adoption or compliance. Not only does this provide the elusive value but also supports maintenance delivery.
In the last two years, Severn Trent reliability engineers have reviewed and implemented improvements to asset care (operation and maintenance) for 30% of the company’s asset base. Each improvement business case is logged, and the net benefits recorded in a ‘’Task Bank”, the objective being to demonstrate maintenance value in one illustration. The Task Bank records asset availability, reliability and maintainability improvement, reduction in field staff time – both proactive field staff time (removal of non-value adding tasks) and reactive, including both normal and overtime. It also records non-manpower costs such as: hired and contracted services, chemicals, materials, as well as quality improvement and risk impact such as pollution reduction, sample losses, and health and safety risk reduction. It is important to note that benefits may not be realised immediately on implementation; where STW implements a change in approach, performance is monitored and evaluated over time against the pre-work baseline.
Net benefits achieved
The table below represents the net benefits achieved since the OEE-based approach began. Measures shown are examples of the factors that affect the respective OEE elements. The overall availability improvement is not aggregated in this table because of the difficulty of comparing different types of asset. However, the Asset Health Dashboard does aggregate availability up to site level.
Job volume is number of physical work orders, reduced either by the impact of moving from a proactive to a reactive approach, or the reduction in proactive tasks by the removal of non-value adding activity. Job volume is shown as an availability factor because it represents the reduction in physical interventions to the asset. Any financial benefit will be included under productivity.
Productivity is relatively straightforward direct opex or capex cost savings, plus a record of reduction in direct labour normal time. Quality is like availability: the benefit is measured as a count of assessments leading to a benefit. As with availability, the quality impact is aggregated in the Asset Health Dashboard.
OEE and the selection of the best maintenance care approach have delivered benefits for Severn Trent Water, and the opportunity continues through development of new technology and techniques. The adoption of an OEE mindset will allow an organisation to drive out costs of failure, reduce variations in product and service and achieve operational excellence.
Conclusion
OEE is an established tool helping manufacturing and production environments to understand their comparative asset performance, providing insight to drive investment and care decisions to manage asset performance.
Severn Trent has approached the integration of OEE by:
- Establishing an OEE mindset, process sites and transmission systems can operate as factories.
- Transition from historical asset measures to OEE, aggregating datasets to provide a continuous site/asset performance lens, comparing performance across the estate.
- Building collaborative teams and processes to analyse and utilise the performance data in investment and care improvement.
a. Asset Investment, Optimisation.
System view. Using real time data to understand and compare system performance and position in relation to the designed OEE envelop. Taking the holistic view of the whole factory and distribution system into account to make effective and efficient decisions, making the best investment decisions balancing OEE to optimise overall position within the envelop.
b. Asset Care.
Asset View. Using real time data to understand where the point asset challenges are, assessing the current care that is delivering the performance and whether improvement is possible by turning a specific OEE dial. Continuously looking for the opportunities and delivering value to help assets meet or beat their life and performance expectancy through OEE optimisation.
Overall Equipment Effectiveness is embedded as the core key principle within STW Asset Management for understanding how availability, productivity and quality interact with each other, and ensuring optimum asset management decisions are made, both for the investment and for the care stage of an asset’s life cycle.
The adoption of sound maintenance principles and analysis techniques such as FMEA, together with good quality data, ensure optimised care plans are developed and adopted, stabilising and in many cases improving OEE.
Having a team of dedicated reliability engineers willing to share their knowledge and work collaboratively with staff in the field is critical to success. Collaboration and diverse decision-making in partnership with a sound basis on which decisions can be formed is key to STW success.

Hayley O’Malley
Head of Asset Strategy and
Performance, Severn Trent Water

Phil Mason
Asset Care Business Lead,
Severn Trent Water