


ABSTRACT
The following case study describes a proven method of how to detect failures in the suction or discharge valves inside positive displacement pumps with a unique method of vibration analysis. The determination to find a reliable method of detection led us to a greater understanding of our equipment and processes, including working with the vendor to implement a design change. This paper will describe a journey from repeated failures to improved equipment reliability and lower maintenance costs.
Note the following often used terms and abbreviations:
“Spike Energy” = “gSE”
(high frequency processing technique developed in the late 1970s)
“Time Waveform” = “TWF”
Introduction
Yara Belle Plaine is a nitrogen fertiliser plant located in Saskatchewan, Canada. For many years this site was the largest producing single train nitrogen fertiliser plant in the world. Predictive maintenance technologies (PDM) were employed during the commissioning of the equipment in 1992, and are actively used in reliability efforts today. Fortunately, highly skilled and experienced management and employees with PDM backgrounds were available to start up, operate, and maintain the new plant.
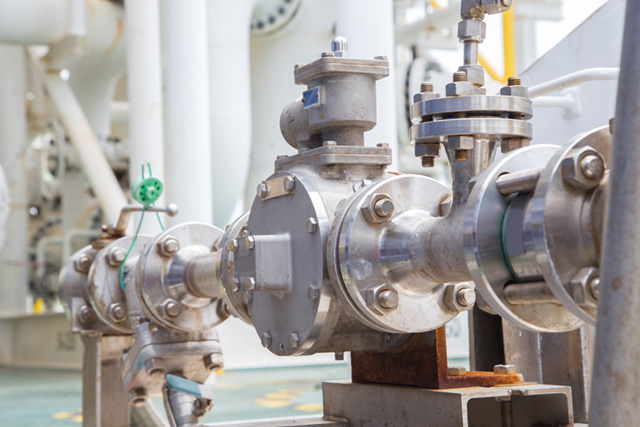
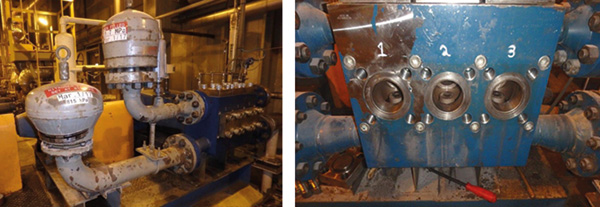
Over time, knowledge and experience with PDM technologies grew exponentially. In the early 1990s, portable vibration monitoring was advancing and industries could see the potential, but there were only a few vendors to choose from. Vibration technology is predominantly used to monitor the typical assortment of rotating equipment found at industrial plants such as pumps, fans, motors, compressors, turbines, conveyors, gearboxes, and so on. This paper focuses on positive displacement pumps like the one shown in Figure 1.
Case history
Reciprocating positive displacement pumps like the one shown in Figure 1 operate in many different industries around the world. Reciprocating pumps move fluid using one or more oscillating pistons, plungers, or membranes (diaphragms), while valves in the pump-head restrict fluid motion to control the desired fluid direction.
During the suction stroke the plunger retracts, decreasing the pressure in the chamber and causing the suction valve to open, resulting in the fluid entering the cylinder. In the forward stroke, the pressure in the chamber increases, and the plunger pushes the liquid out through the discharge valve and into the discharge pipe at a high velocity and high positive pressure.
The Yara Belle Plaine plant contains a number of triplex plunger pumps of various sizes that operate at very high pressures. The plungers, seals, discharge valves and suction valves all come into contact with the fluid being transferred, and the material choices are based on the fluid transferred.
Typically, industrial plants use vibration analysis to monitor the condition of the rotating equipment with respect to bearing faults, looseness, alignment, imbalance, plus many other mechanical issues. In this paper the discussion turns to how vibration analysis was used to determine the condition of the suction and discharge valves in the pump-head of triplex positive displacement pumps and, specifically, whether these pump valves were passing.
Why was it useful to know whether one or more of the valves in the pump head was passing? It is helpful to start by describing the process to discover that monitoring the condition of these pump valves was even possible.
The problem
Early on, the valves were failing often in the plant’s midsize pumps. Vibration data was collected every two weeks on these pumps, but the valve condition was not found in the vibration data. We tried collecting overall vibration (velocity), spectral data (velocity and acceleration), overall high frequency envelope data (HFE) (spike energy/gSE), and time waveforms (acceleration and velocity) to try to discover some indication that signified the valves were failing. Even the low-tech stethoscope method was tried (and I hate to admit, even the screwdriver to the ear).
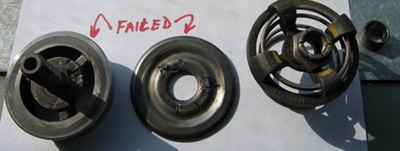
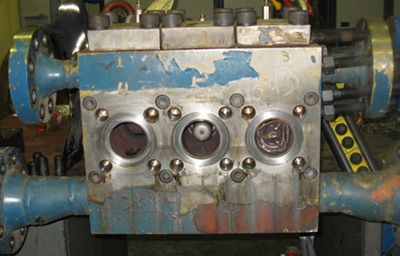
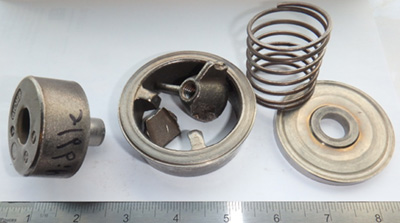
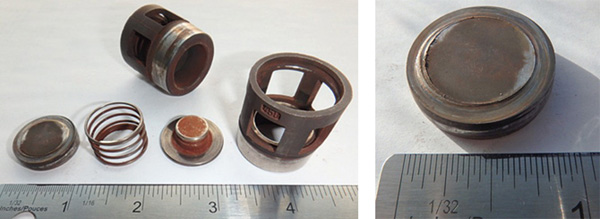
This went on for a few years and the pump valves continued to fail in the midsize pumps due to premature wear and catastrophic failure. In most cases, the valve disc and seat were becoming wire-drawn which caused a leak path. See Figure 2.
As our understanding of vibration analysis evolved, we learned that the Spike Energy (gSE) Time Waveform (TWF) could clearly identify bearing fault frequencies in rotating equipment. The gSE time waveform was a rectified waveform in the positive domain which was ideal for detecting non-synchronous frequencies in the ultrasonic range.
Spike energy measurement was developed in the late 1970s and has been used in various industries for machinery condition monitoring and fault diagnosis. As compared to other filtered high frequency enveloping methods, spike energy has a unique signal filtering and detection process. In addition to the traditional spike energy overall measurement, spike energy spectrum and spike energy time waveform were developed and used for vibration analysis. It may be possible to replicate these results with the HFE measurements used in other portable vibration instruments by finding the right combination of settings.
Confidence using gSE motivated us to try this measurement on process valve leaks. There were issues in the process plant in isolating a piping system for a hydrotest. The system had a number of isolation valves, but one or more valves was passing, preventing completion of the hydrotest.
The theory was that if a process valve was slightly open, it should emit high frequencies or possibly ultrasonic frequencies. The smaller the opening that the liquid or air had to pass through, the higher the frequency. Overall gSE was tried because it was a measure of ultrasonic vibration frequency. This turned out to be unsuccessful because there needed to be a baseline measurement to compare with in order to be certain that the process valve was passing. Only the gSE Time Waveform could show us the frequencies needed for analysis.
That exercise led us back to the pump valves, and the collection of gSE Time Waveforms was added to the two-week vibration routes on the midsize triplex pumps. The difference between this and the process valves was that, by collecting data regularly, baseline data was gathered from when the valves were in good condition. The next valve failure would allow us to study the historical data that had been collected to find out if this new measurement was going to help.
Before a failure occurred, we delved into what the pump valves were doing. Refer to the parts in Figure 2. There was sliding motion between the sealing disc and the valve stem along the bushing; spring action; impacting when the disc landed on the valve seat; looseness; and there was liquid flowing through the valve openings. The valve disc travelled from a fully closed position resting on the valve, to fully open, at some distance away from the valve seat.
The conclusion was that flow-induced high frequency vibration should be greatest when the valve disc was as near the fully closed position as possible but still allowing fluid to pass by the sealing surfaces – through a small opening. How could we prove and measure this?
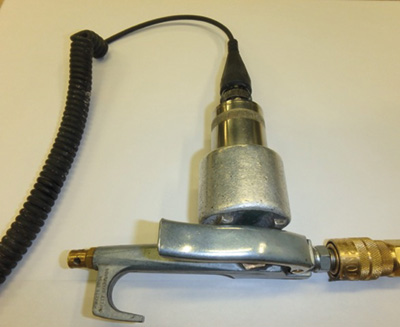
Spike energy time waveform discovery
Figure 3 shows how an accelerometer with a magnetic base was attached to the trigger nozzle on an air hose in the maintenance shop. With the data collector in live mode measuring overall spike energy (gSE), the nozzle was triggered open and closed. The change in the overall spike energy level was observed. Once this reaction was confirmed, the data collector was set to store the gSE time waveform using various collection filters until we found the best parameter.
When the air passed through the air nozzle, the rectified gSE TWF clearly displayed a unique pattern, with plateaus in the TWF for the duration of the leak. This allowed us to associate a vibration measurement to the pump valve condition. Whether liquid or air was passing through a small opening, the results remained the same: ultrasonic vibration frequencies were generated.
Figure 4 and Figure 5 show the gSE Time Waveforms collected from the pump-head of the midsize pumps. Vibration readings were collected from each pump valve location, for three suction plus three discharge valves.
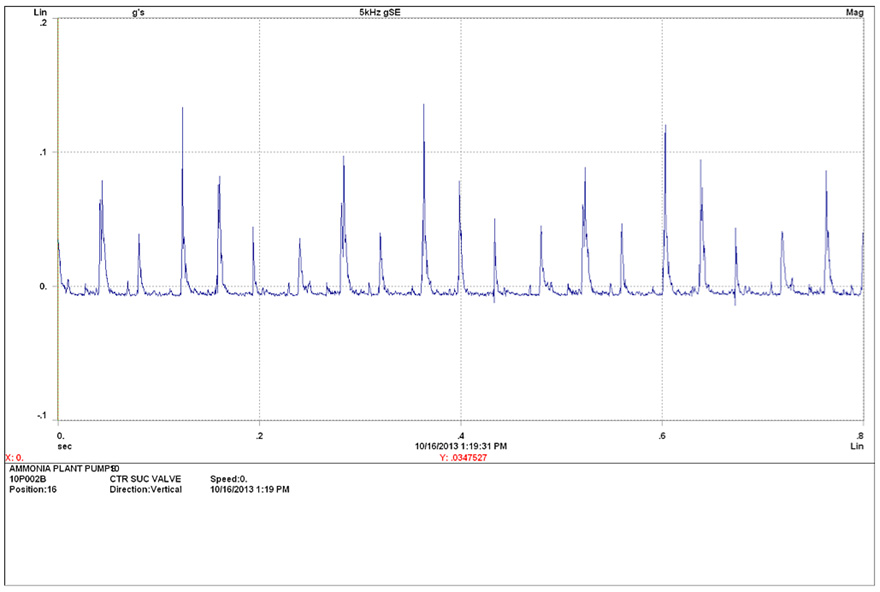
Figure 4 is the time waveform when the pump valves were in good condition. The narrow spikes in this gSE time waveform represent the smallest of openings when each valve is nearest the fully closed position.
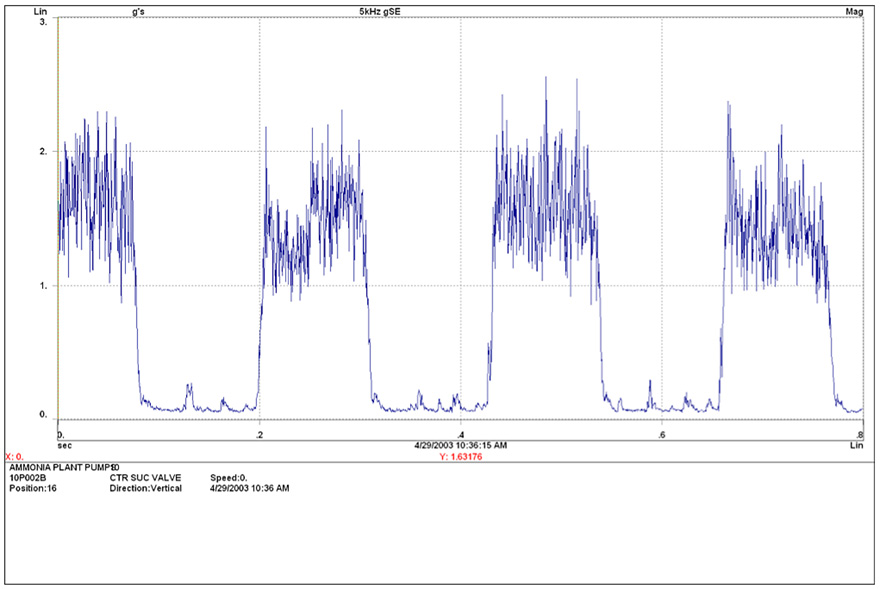
Figure 5 is the time waveform when a valve was passing. It consists of normal ultrasonic emissions from the valves opening and closing, separated by plateaus of high ultrasonic vibration. The duration of the plateaus is equal to the time elapsed by the plunger stroke in one of the directions (suction or discharge stroke), and is equivalent to one half-revolution of the pump shaft. The difference between the time waveforms is clear.
Attention was focused on the mid-size pumps before moving on to the smaller and larger plunger pumps. There were more valve failures on the mid-size pumps. Now that we could see the failures occurring, there was a greater understanding of the level of unreliability and the failure modes. This led to discussions with the pump vendor for ways to improve the reliability. The vendor offered the option of installing valves of an upgraded design. The new design proved successful and rarely failed.
We were sufficiently confident with the results to add this unique vibration measurement to the route readings collected on all the other triplex pumps on site. The valve failures on the other pumps were less frequent, but this failure mode could be seen as it progressed along the P-F curve.
There were many benefits:
• Time to plan the repairs and organise the parts, labour, and tools required
• More accurate records in the CMMS
• Operations had less disruption to the process
• Valve replacement could be combined with other work on the same equipment
• Data to support RCA and FMEA
• Safety and environmental concerns could be addressed.
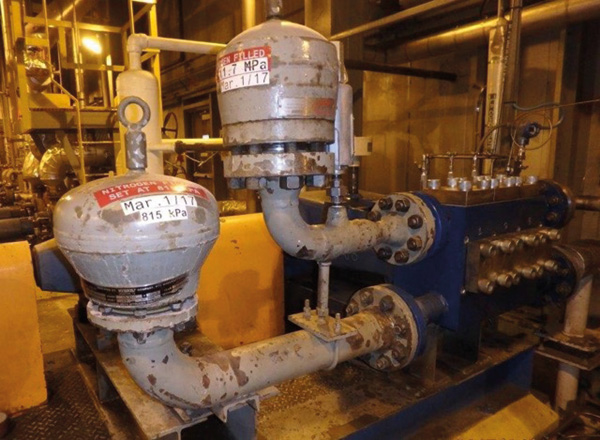
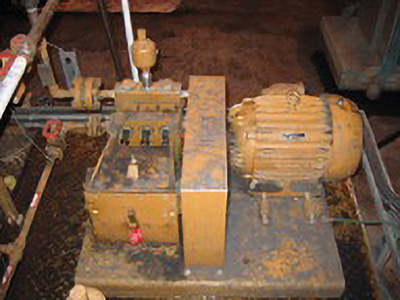
Midsize triplex pumps
The midsize pumps like the one shown in Figure 6 had the most frequent valve failures, which made it necessary to learn how to detect pump valve failures.
To illustrate another benefit of monitoring the pump valve condition, Figures 7 and 8 show the valve damage at the end of its mechanical life on the P-F curve. The pump valve in the farthest right cylinder in Figure 7 failed catastrophically and resulted in collateral damage. The pump could not meet process requirements, had mechanically failed, and had to be shut down for maintenance. Repairs were not isolated to the valves and the repair costs were very high.
The valve from a midsize pump in Figure 8 also failed mechanically. Pieces of the valve broke apart and were free to flail around inside the chamber for this plunger. This caused damage to other parts inside the pump and had the potential to cause damage downstream of the pump.
Large triplex pumps
The pump in Figure 9 was the largest of the plant’s plunger pumps, a high pressure, high volume ammonia liquid process pump. The equipment train consisted of a 900 hp electric motor, variable speed torque converter, triple reduction gearbox, and pump with 150 mm diameter plungers operating at over 18 MPa.
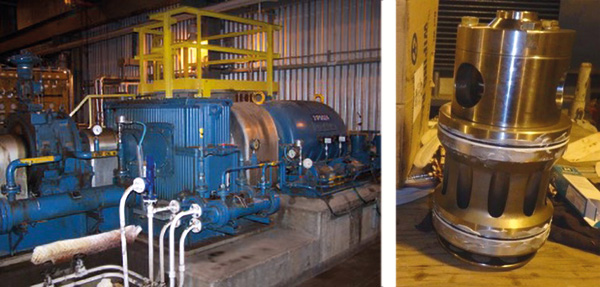
In these pumps, the suction and discharge pump valves were integral. These are more sophisticated but perform the same function as two separate valves. These valves are large, heavy (over 50 kg), and expensive, and operate in a hazardous service requiring more planning, preparation, and safety requirements to replace them.
For this pump, a method of determining which valve(s) were passing was developed by setting up a timing mark on the pump input shaft and performing synchronised time waveform analysis using the gSE vibration measurement units. This allowed for the opportunity to replace only the valves that were passing, if desired.
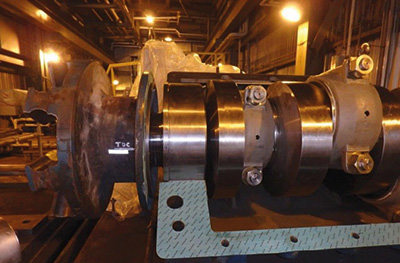
During a plant turnaround, when the pump crankcase was open for a complete pump rebuild, the crankshaft was rotated so that the plunger closest to the drive side of the pump was placed in the top dead centre (TDC) position. Reflective tape was attached to a portion of the input shaft that protruded outside the pump case (see Figure 10).
The reflective tape was placed in the horizontal plane to be used as a timing mark for the synchronous time waveform measurement. That way the position of each plunger could be identified in the resulting synchronous time waveforms to identify which valve was open or closed and when. Note that these pumps were variable speed, which made the timing crucial to this measurement.
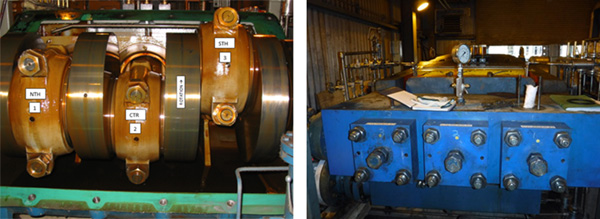
Note also that vibration readings were collected on each cylinder head, and that the vibration frequencies from all the cylinders appeared in each synchronous time waveform. The small yellow dots on the cylinder end plates were the locations where the vibration measurements were taken – see Figure 11. The dots provided a level of consistency for data collection and data integrity.
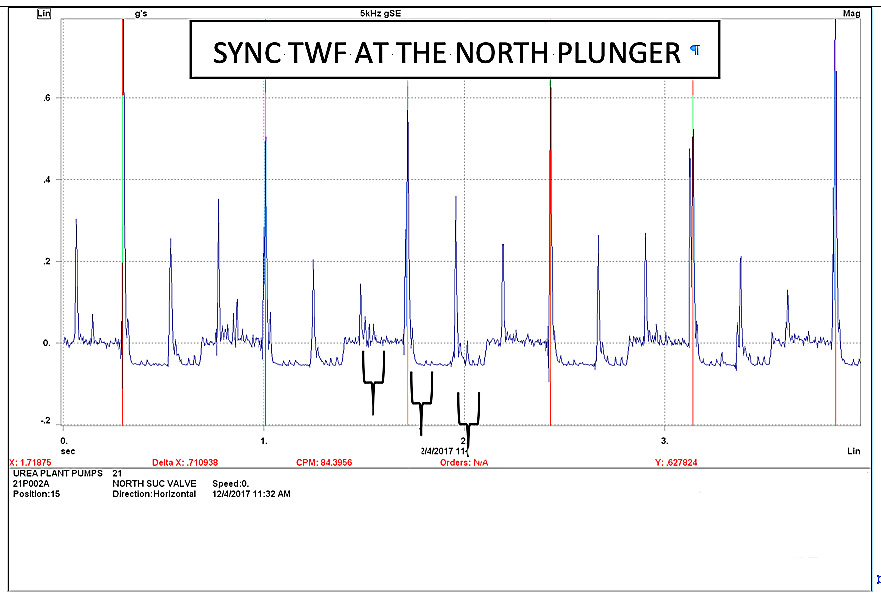
The timing sequence of the plungers in this pump was: North (1), Centre (2), South (3).
The valves are seen passing when there are plateaus in the gSE time waveform.
Three vibration readings were taken on the pump-head. One reading in line with each plunger.
The spikes in the TWF are at the end of the plunger strokes when the discharge/suction valves open and close – the moments when the valve openings were the least.
The start of the synchronous time waveform in this case (at 0 seconds in Figure 12) was when cylinder number one (North) began its compression stroke. This was the moment closest to the opening of the discharge valve on that cylinder. From then, the position of all the valves and plungers within their cycles could be derived. Then, from the patterns in the TWF, it could be seen if any, and which, valves were passing. Figure 11 (left) and Figure 12 are used together to show the reader how the position of each cylinder was identified.
One full rotation of the crankshaft is 360 degrees of rotation. For 180 degrees of shaft rotation, the plungers are in either a compression stroke or a suction stroke. The plungers have ±120 degrees of phase difference between each other. The speed was measured by the timing mark and a laser tachometer. The signal from the laser tachometer was fed into to the portable data collector and was required for the synchronous time waveform measurements. These relationships are seen in Figure 12. The results of this TWF show that the valve for the North cylinder was passing on the compression stroke. Six rotations of the crankshaft are shown in the TWF, with the valve passing on each rotation (one plateau/rotation).
Small triplex pumps
Regarding the plant’s smallest triplex shown in Figure 13, the pump valves are much smaller, about the size of a thimble of thread. The lack of seal of a pump valve in this situation resulted in the pump failing to satisfy process requirements and it was taken offline by Operations. A standby pump had to be put online.
The passing valve caused flow and pressure fluctuations in the seal flush to another pump. The low-level pressure monitors triggered an alarm and process logic control caused the standby pump to start automatically. A high priority work order was initiated to replace the pump valves.
If the standby pump had also failed, there would have been a cascade effect, causing other pumps to shut down and a loss of production. This proved that smaller pumps with much smaller, less expensive valves could result in large economic losses.
The pump valve in Figure 14 (left) failed to seal in a different mode from the larger pump valves. The valve disc had a flat surface when in new condition. Over time, the thousands of cycles that the valve opened and closed caused the perimeter of the face of the valve disc to wear down – Figure 14 (right). This was the surface of the disc that would contact the valve seat on each cycle and was considered normal wear.
Slide wear on the outside diameter of the valve disc plus internal slide wear on the inside of the valve body resulted in increased radial clearance between the disc and valve body. At some time, an event occurred that caused the valve disc to shift position sideways. The disc then failed to land on the valve seat in the same location along the wear surfaces. This caused part of the unworn face of the valve disc to land on the valve seat during each cycle. The result was the disc landing at a slight angle in the closed position and leaving a small uneven gap between the disc and seat, a leak that caused ultrasonic frequencies that could be measured and seen in the gSE time waveform.
Since this was a discharge pump valve, the higher pressure in the discharge pipe caused liquid to flow back into the chamber of this plunger during its suction stroke. This explained the pressure and flow fluctuations.
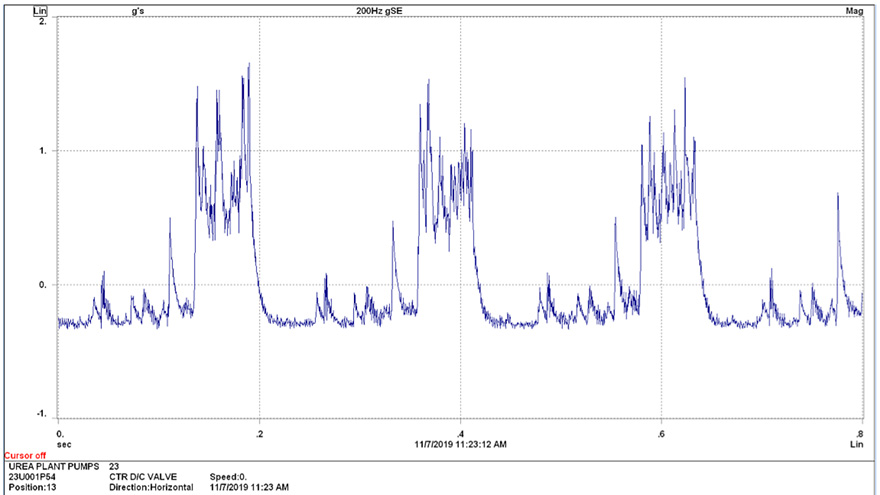
One discharge pump valve had failed to seat properly. The plateaus from the lack of seal can be seen in the gSE Time Waveform in Figure 15. In this case, the lack of seal in the pump valve was occurring when this plunger was on its suction stroke.
The pump valves were small and inexpensive, so all the valves were replaced during the maintenance activity. There was normal wear on all other valves but changing all the valves improved the future reliability of the pump. This is a situation where it was not important to know which valve had failed. Logic dictated replacing all valves.
Conclusion
In summary, the condition of the valves in positive displacement pumps can be monitored. Learning how vibration technology could be used in this application took years to accomplish but the rewards were well worth the effort. We also learned how to think creatively and use a common PDM technology in a non-standard application.
The benefits of knowing when pump valve defects have begun can range from economic to safety. Planning and scheduling are improved. There could be RCA and FMEA activities that result in design or operational changes. Production losses and failure to meet commitments to customers could be avoided. Depending on the level of hazardous product flowing through these pumps, safety and environmental issues may be avoided. Positive displacement pumps are often high pressure, high flow equipment. The more that is known about condition of these pumps, the more safely and reliably they can be operated.