

ABSTRACT
In 2017, PXL University of Applied Sciences and Arts (Belgium) started a multidisciplinary project called Smart Factory. In this project a simple automated production line was transformed into a smart production line by integrating an Enterprise Resource Planning system and a product configuration application. In addition, students designed a digital twin for educational purposes to visualise the benefits of data and the communication between machines, i.e. the programmable logic controller (PLC) and a cloud database.
In this research project, a living lab was made, in which the communication between the PLC (Beckhoff), a cloud computing platform (Microsoft Azure) and the ERP (Fujitsu Glovia G2 including factory planning) could be visualised and demonstrated in order to show the benefit from machine data and machine learning for production and maintenance.
Introduction
In recent years, new developments in cloud connected smart sensors and smart machines arose with the advent of the internet of things (IoT). Integrating IoT makes it possible to monitor and control machines and installations individually and continuously, and to see how these can interact intelligently: the industrial internet of things (IIoT). In doing so, smart sensors in machines, installations, processes, buildings, and logistics produce an enormous amount of data (big data).
Although big data is a potential goldmine for any company, many companies are not yet fully convinced of the opportunities that lie therein. Yet the gigantic amount of data that companies produce on a daily basis would allow them to increase their market efficiency and to predict future opportunities.[1]
There is the misconception that big data is a privilege for large companies and high budgets. Fortunately, though, that is history. Prices for analytical software, cloud access and smart sensors have dropped significantly, enabling start-ups and small and medium-sized enterprises (SMEs) to purchase them as well. There is a clear need for a fourth industrial revolution – known as Industry 4.0 – that integrates IoT and maximises the benefit of big data collected, in order to create uptime improvements, cost reduction and lifetime extension of ageing assets.[2]
Industry 4.0 is an upcoming movement in manufacturing industry which strives to connect all machinery and data to create a factory which is “smart” and “flexible”. The PXL Electromechanics research team in the department of Green & Tech, in collaboration with Beckhoff, Fujitsu Glovia G2 and Govaplast, conducted research on:
• how to make machines smart by implementing artificial intelligence;
• how to connect this data into the maintenance and production planning of the ERP tool Glovia G2.
Research goals and approach
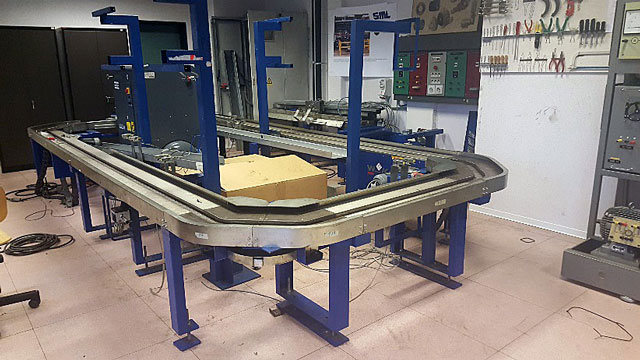
In 2017 the project Smart Factory started at the PXL Tech Department of PXL University of Applied Sciences and Arts in Belgium, when different student groups renewed an old Ford production line and gave it a new application as a production line for candle holders (see figure 1).
At the same time the research group was working on creating a living lab at PXL Tech with two main goals:
• implementing machine learning in a Beckhoff automated system;
• implementing Glovia G2 on the production line and looking for ways to generate production orders (or work orders – WO) as well as maintenance orders (or service work orders – SWO) in production planning.
The ultimate goal was to create a smart factory that allowed users to:
• predict upcoming failures;
• test and demonstrate machine learning;
• demonstrate the communication between the machines, Azure Machine Learning, the Beckhoff PLC, Glovia G2 and to visualise the real-time data.
The first phase was a literature review which compared different possibilities regarding cloud storage, visualisation and machine learning. In parallel with the literature review, design of the new production line, the development of a business blueprint and the implementation of Glovia G2 began.
The subsequent phases were creating a living lab on the PXL campus and transferring the method to the Belgian company Govaplast NV.
Results
Literature review
The literature study was conducted in order to decide which was the best analytic method, visualisation and cloud storage for this research project. The following parameters were taken into account in the study: price, communication options (with a PLC and ERP tool), user friendliness and programming language.
The choice of a particular online storage tool strongly depends on the number of messages sent per day or month. For small applications such as the PXL living lab (less than 8000 messages per day), Azure was cheaper, as this could be used free of charge.
For data analysis Azure Machine Learning (AML) was used because of its user-friendliness, which required minimal prior knowledge in programming. As shown in figure 2, AML uses a visual programming language based on the idea of “boxes and arrows”, in which boxes or other screen objects are treated as entities, connected by arrows, lines or arcs which represent relations. The visual interface offers a rich set of modules covering data preparation, feature engineering, training algorithms, and model evaluation. Furthermore, it is entirely web-based: no software installation is required.
It is easy with Microsoft’s Power BI visualisation tool to visualise real-time data such as the turnaround time of orders, the total waiting time, average production time, the ratio between successful and failed cycles and overall equipment effectiveness (see figure 3).
Design of the living lab Glovia G2 is an ERP tool developed by Fujitsu Glovia, part of the Fujitsu organisation. Glovia G2 is made by the manufacturing industry for the same industry. Its advanced ERP technology can be applied to all production concepts: make-to-order, make-to-stock, assemble-to-order, configure-to-order, and engineer-to-order. Glovia G2 has an open architecture: it supports XML, SOA and web services, so linking to other applications is no problem. This allows organisations to collect data from various applications. Valuable information can be extracted from this data, real-time insights and statistics can be followed and inspected. [3]
The most important aspect was to create an effective structure in Glovia G2, keeping in mind the possibility to implement maintenance work orders in the production planning.
Because of the intricacy of Glovia G2 and the many options it offers, this study only focuses on the basic features which are required: creating sales orders (SO), work orders (WO), service work orders (SWO), and releasing work orders as visualised in figure 4.
The main difficulty in this phase was to integrate maintenance/service work orders into production planning. Therefore, a workaround was created in which an extra product item was added for every machine, namely “product machine maintenance”. This simple extra product item enables the PLC to request a maintenance action for a specific machine, based on the outcome of the AML analysis.
When AML receives measurement data from a machine outside the predefined operating point, AML will send a message to the PLC with an associated level of urgency. The PLC will then make a request for a work order in the production schedule. The urgency will depend on the extent of the deviation from the normal operating point. The measurement data are current, voltage, temperature and average vibration value.
Machine learning
To discover and test the possibilities in AML, readily available data from the PXL campus were used. A small test project was designed to intelligently control the ventilation of a classroom based on the number of students present, the timetable, the current temperature and carbon dioxide concentration, the outside temperature and the current ventilation level.
The objective was to maintain the CO2 value below 1000 ppm. Before 2017, the campus building occasionally had CO2 values higher than 4000 ppm.The first improvements were measured in 2018. The solution uses machine learning to predict the CO2 concentration in real time both one hour and two hours in the future by comparing the situation at a given point with historical data. Ventilation control uses this prediction to adjust the ventilation level accordingly.
Table 1 shows that in 2018 CO2 concentration remained below 1000 ppm about 70% of the time. The value of 2000 ppm was almost never exceeded. Moreover, the classrooms were used more frequently, yet energy consumption hardly increased, suggesting that the integration of machine learning improved classroom comfort considerably, with lower energy costs on top of that.
After this test project, it was relatively easy to translate the machine learning approach to the production line and, based on machine data, make the machine sufficiently intelligent that it could predict failures and assign a level of urgency. The PLC then translates this information into a service work order and sends a service work order request to factory planning.
Programming and communication
To establish communication between Glovia G2, the PLC and Azure Machine Learning, several different connections had to be established. To give a better understanding of how all these systems were connected to each other, a network tree was created (Figure 5).
The MQTT broker
In this project an MQTT broker was used. This is a software messaging protocol hosted on a device such as a Linux server or a Raspberry Pi. It is used to communicate between different devices and sensors. The broker used in this project was Eclipse Mosquitto, which is a lightweight opensource message broker.[4]
Brokers allow for communication between devices through a publish-subscribe pattern. One or more devices can publish process data to a “topic” on the broker. A topic can best be described as a free space in which data can be stored. When other devices need this data for their process, they can subscribe to this topic. If there is new data available, this will be pushed to the subscribed devices.
To store the machine data, two types of database were used. Glovia G2 uses a Microsoft SQL database to store all the data, while a MySQL database is used to store process-related data such as the event log. The databases are comparable and largely use the same code. Data is stored in the form of tables.
Databases: MySQL and Microsoft SQL
To obtain data, different SQL specific commands are used. These commands can range from short and simple to long and complex commands. For this project, only a few fairly simple commands are required. There is the “SELECT” command, which selects certain data from a table. This command often requires the help of specific filter-commands such as the “WHERE” command. Second, the “ORDER BY” command is used for ordering the data according to one of the variables in the table. Finally, another main command “INSERT” is used to add a new row of data in a table.[5]
Node-RED
Node-RED is a development tool used to virtually connect various hardware devices, application programming interfaces (API) and online services with each other.[6] The software will set these links by connecting nodes together with wires, creating projects which are called “flows”. Node-RED can run on small and low-cost devices such as a Raspberry Pi or another Linux-powered device. In addition, Node-RED allows for JavaScript functions and code to be executed. However, a selection of many useful functions is already present in function libraries.
The flow from the Smart Factory project shows that the connections in Node-RED are fairly straightforward. First, Node-RED subscribes to the correct MQTT topic with the broker so that it will receive updates as soon as new data becomes available. Second, this string of data is reformatted through a JSON node. Third, a piece of JavaScript code is used to change the incoming data to a MySQL insertion command. Finally, this command is sent to a MySQL database which inserts the data into the correct table.
Communication with the ERP system:
In Glovia G2, new work orders for production and maintenance cycles are created. To send these work orders to the production line and get an update on the status, a two-way connection was established. A second connection is needed to log all the production details in a dedicated event log which will be stored in a MySQL database. This meant that knowledge about MySQL and Node-RED had to be acquired.
Visualisation
As soon as the connection between the production line and the MySQL event log database is established, the data can be visualised and analysed to calculate the most important performance indicators (KPIs). For the visualisation Power BI was chosen, a Microsoft software package which makes it possible to process raw data and turn it into a visualisation [7] which can show the various KPIs of the production process.
Power BI is comparable to Microsoft Excel, but distinguishes itself with its extensive functionalities and the ability to process large quantities of data in a short period of time.
The data used in the analysis of a Power BI program can be obtained from many different sources such as MySQL databases, web services or Excel worksheets. This project derived the data from the MySQL database.
To prepare the data and create extra columns or tables, Power Queries and data analysis expressions (DAX code) are used [8] [9]. Power Queries are pre-programmed actions in Power BI which can be used when only simple equations need to be performed. For complex actions, DAX code is the better option. These are manually written lines of code which resemble Excel formulas and Visual Basic code. The same DAX code is used when creating measures, which are momentary calculations that return only one value. These measures are used to calculate the predefined KPIs.
The different pages on which information can be visualised in Power BI are called dashboards. To make effective dashboards, such as overall equipment effectiveness, turnaroud time order, waiting time, average production time and so on, this also needs to be implemented in the PLC programming. Therefore, the time between every action in the production flow is stored in an event log database (as illustrated in figure 7 below).
Implementation in a company
The goal to implement the project in a Belgian company was cancelled due to the Covid-19 pandemic and replaced by creating workshops and an educational digital twin.
The workshops were developed to transfer the methodology to the Govaplast NV company. The workshop is based on the Six Sigma concept, in which data collection and analysis is one of the most important and often difficult steps of the process.
The educational digital twin was developed to create more production data quickly without making real products in the living lab. The educational digital twin can simulate a full production day in one hour, without any manual interaction. This makes it possible to start the system at the beginning of a workshop. While the production is running, the teacher can then take a theoretical approach to analysing production data. When at least one hour has elapsed, a practical analysis can be performed based on the data generated by the simulation.
In this digital twin, adjustments were needed in the PLC code and the Power BI program and it needed to be connected to a simulation in PLC training package Factory I/O. For example, in the PLC program, the connection with the Glovia G2 system is removed and replaced by an extra piece of PLC code which continuously adds new orders to the database. Different production orders and maintenance orders are generated completely at random.
The adjustments that had to be made in Power BI were mostly related to the time-related calculation. Since a full production day is now equivalent to one hour in reality, there were some additional challenges, particularly when establishing the relationships between different tables.
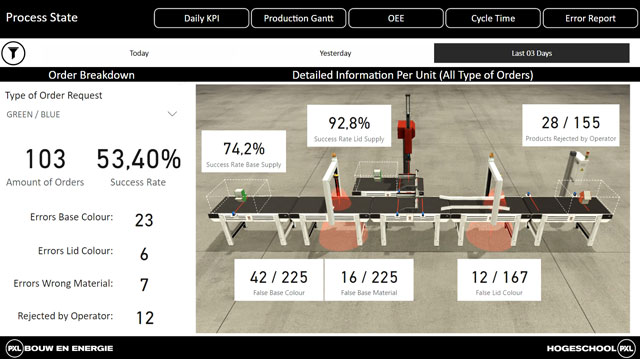
To create a realistic simulation, some failures were deliberately integrated into the simulation. These errors can be divided into errors related to “performance” losses (e.g. waiting times: time that the process took in excess of the ideal production time) and those related to “quality” losses (e.g. losses due to rejected or incorrectly produced products or product combinations: incorrect material as well as incorrect colour).
In the PLC visualisation it is possible to define the number of failures that will occur in the simulation. All this information can be visualised in several dashboards in Power BI (see figures 9-11)
Conclusion
The project has demonstrated that it is possible to make machines and production lines or processes so intelligent that they can predict failures and schedule preventive maintenance in production planning according to the level of urgency. To realise this, a custom-made middleware layer (ie a basic manufacturing execution system) was created as shown in figure 12.
To support SMEs, a workshop was developed in which the researchers thoroughly discuss and teach the different steps in this process, making use of the smart factory living lab at PXL.
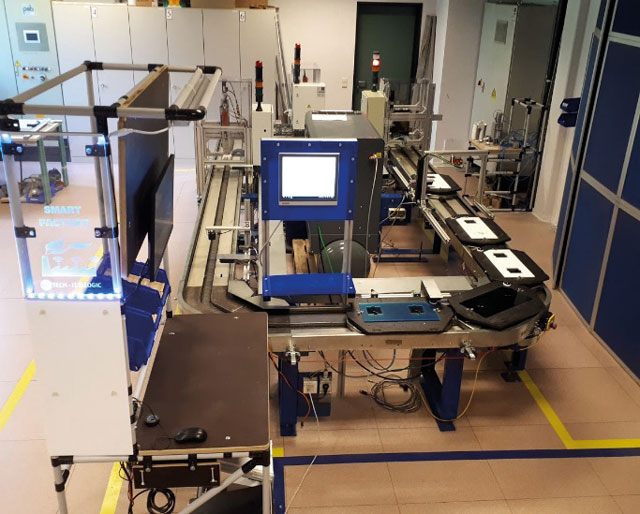
Figure 13: PXL living lab smart factory (2019
In addition, once the process of creating the intelligent production line has been carried out, Power BI can also serve to monitor improvement and make sure that it lasts.
Acknowledgements
We would like to thank the supporting companies: Wim Vancauwenberg (Bemas), Patrick Gielis (Beckhoff), Eddy Govaerts and Tom Vandebroek (Govaplast NV), Kris Vekemans (Fujitsu GLOVIA G2), Peter Opregt (Agidens), Michaël Daenen (Hasselt University) and the following students for their help: Geert Caberg (2020), Daniel Frankort (2020), Stijn Spapen (2019), Yannick Geukens (2019), Kaan Sahin (2019), Victor Sosa (2019), Tim Buntinx (2018), Bert Hoogmartens (2018), Bjorn Smeets (2018), Kurt Mehmet (2018), Brent Deelkens (2017), Wouter De Backer (2017), Jens Martens (2017).
References
[1] Industry 4.0 – hype or reality, www.pwc, Belgium, 2017.
[2] Predictive maintenance 4.0 – Predict the unpredictable, pwc, Belgium, 2017.
[3] Fujitsu, Glovia, Fujitsu, [Online]. Available: https://www.glovia.com/.
[4] Eclipse Mosquitto, Mosquitto, [Online]. Available: https://mosquitto.org/.
[5] w3schools.com, SQL Tutorial, [Online].
Available: https://www.w3schools.com/sql/.
[6] Node-RED, Node-RED, [Online]. Available: https://nodered.org/.
[7] Microsoft, Power BI, Microsoft, [Online].
Available: https://powerbi.microsoft.com/nl-nl/.
[8] P. LeBlanc, The How and Why of Power BI Aggregations, Guy in a Cube, 4 03 2020. [Online].
Available: https://www.youtube.com/watch?v=EhGF372t0sU. [Accessed 03 2020].
[9] P. LeBlanc, Configure Power BI Aggregations, Guy in a Cube, 11 03 2020. [Online]. Available: https://www.youtube.com/watch?v=kytYzjTXUHs. [Accessed 03 2020].
Gwen Vanheusden,
Automation and Data Processing Engineer (Department PXL-Green & Tech),
Kristel Deckers,
Machine Learning Engineer (Department PXL-Green & Tech)
Servaas Tilkin,
Software Engineer (Department PXL-Research)
Stefan Dreesen,
Logistics Engineer (Department PXL-Business)
Patrick Pilat,
Project Manager (Department PXL-Green & Tech)
All researchers work at PXL University of Applied Sciences and Arts, Belgium (smartfactory@pxl.be)