


Using a case study of how a plant cut time spent by engineers on reactive maintenance from 80% to 10%, Dennis McCarthy of DAK Consulting argues that the most important improvement was transforming the engineer mindset from fixing breakdowns faster to adding value.
Effectiveness is a measure of how well a process achieves its purpose, a measure of how often that process hits that ‘right first time’ sweet spot. The gap between the Effectiveness achieved and 100% is a measure of the health of the process.
Although the most widely used measure of effectiveness is OEE (Overall Equipment Effectiveness), Effectiveness can be applied to improve any process including Maintenance Management.
So what?
Maintenance is most effective when engineers’ time is directed towards getting the most out of the asset. The table below contains the results from a food processing and packaging plant on their journey from over 80% of time spent on reactive maintenance to less than 10%.
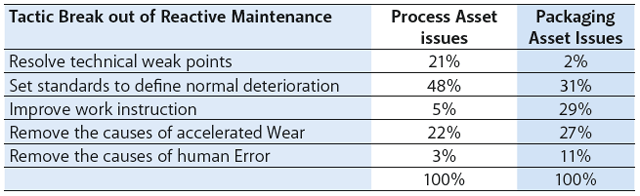
As can be seen here, the biggest barriers to maintenance effectiveness relate to how well work routines are defined and carried out. That is what effectiveness measures. In this case, the biggest barrier to overcome was a lack of robust inspection standards to trigger actions to restore component condition prior to breakdown.
Measuring Maintenance Effectiveness
Effectiveness combines measures for resources used, productivity and quality of output. In Overall Equipment Effectiveness these are Availability, Performance and Quality.
Splitting the losses for each measure into internal and external causes produces six loss categories.
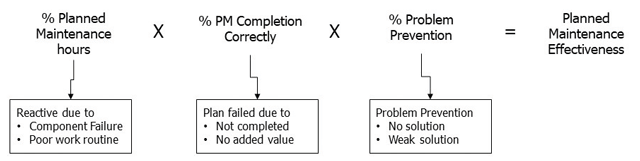
Priority losses categories can then be targeted using the classic Plan-Do-Study-Act cycle credited with transforming Japanese manufacturing industry from third-rate to world-leading by driving progress towards ‘right first time’ outcomes.
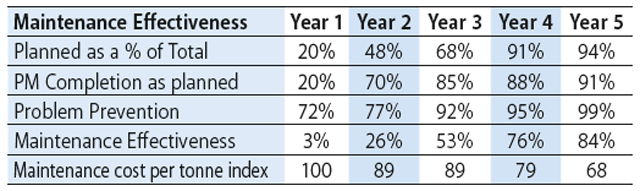
The Effectiveness glide path for the food processor from Table 1 is shown below. This illustrates how, as effectiveness improved and around 40% of engineer time was released, it was redirected to improve the problem prevention score from 72% to 99%. The outcome of improved Maintenance Effectiveness included a reduced maintenance cost per tonne to almost 2/3 of previous levels.
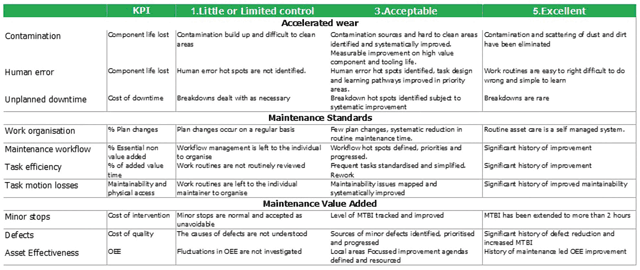
An important TPM concept underpinning the use of Effectiveness is loss tree analysis. This provides a set of improvement glide paths that drive effectiveness up and cost down. The table below summarises the loss tree steps for the case study.
The first order priority was to work on the causes of accelerated wear whilst locking in the gains by improving Maintenance Standards. This dealt with around 70% of recurring failures.
As breakdowns became less common, the focus moved on to improving maintenance value added. The outcome was to extend MTBI (Mean Time Between Intervention) which extended component life (reducing maintenance material cost) and the risk of human error. The most important improvement, however, was the transformation of Engineer mindset from fixing breakdowns faster to finding ways of adding more value. Priceless!