

ABSTRACT
Our latest article about different condition monitoring techniques that can have advantages over conventional Vibration Analysis comes from Geoff Walker of Faraday Predictive. He explains the difference between MBVI (Model-Based Voltage and Current Analysis) and MCSA (Motor Current Signature Analysis) and where and when to apply these techniques.
Introduction
Electrical Condition Monitoring has been used for decades for monitoring the condition of specific items of electrical equipment, but in the more recent past it has been recognised that techniques based on electrical parameters can be used much more widely, including for monitoring the mechanical condition of rotating equipment.
These techniques are particularly applicable for equipment that is inaccessible (eg borehole pumps or submerged pumps) or on which it is difficult to use techniques like vibration analysis (eg jacketed equipment with no direct line of sight into bearing housings).
The Nov/Dec 2021 Maintenance & Engineering featured two articles on how measuring motor current can be used as a condition monitoring and diagnostic tool – one on DC motors, and one on MCSA (Motor Current Signature Analysis). DC motor monitoring is primarily about the relatively slow and steady changes in motor current that can be caused by developing faults or different operating conditions on DC motors.
MCSA by contrast is used on AC motors, and looks at much shorter duration variations in motor current, that appear as distortions on the AC current waveform, giving outputs that can be compared in many ways to the outputs from conventional Vibration Monitoring.
The MCSA article stressed the advantages of electrical monitoring over conventional vibration analysis, listing four key areas:
• Ability to detect both mechanical and electrical faults
• Ability to identify and deal with load changes
• Greater robustness and less vulnerable to damage to sensors
• Ability to provide insights into energy consumption and opportunities to reduce inefficiency.
This article looks at a technology that builds on these inbuilt advantages of electrical monitoring over conventional vibration monitoring, and takes them to an even higher level of capability, Model-Based Voltage and Current (MBVI) systems.
How and why does measuring the motor current tell me anything useful about the condition of my equipment?
The fundamental concept behind the use of motor current for condition monitoring is that the current drawn by the motor driving a piece of equipment is affected by the behaviour of the entire motor and driven equipment system. At the simplest level, load has a big effect.
Most people are familiar with the fact that if you put more load on a motor, it will draw more current. If you overload a motor, it can draw so much current that it can burn out. Conversely if you put less load on a motor, it will draw less current.
So if you have a varying load on a motor, you will get a varying current, and the variation in current will occur at exactly the same time, and therefore the same frequency, as the variations in load. Physical phenomena, such as a rolling element bearing that is starting to fail, which create variations in the torque required to turn the shaft, at a well understood characteristic frequency, will create a variation in the current at that same frequency.
By analysing the variations in motor current, looking for distortions corresponding to the characteristic frequency for the bearing, it is possible to detect and identify the bearing problem developing, and to identify whether it is inner race, outer race, train or ball spin. As the bearing deteriorates, this signal will get stronger, and therefore analysing the size of this signal provides an indication of the condition of the bearing and how far it has deteriorated.
There are also a number of phenomena within the motor that lead to changes in current too, associated not with variations in load, but variations in the flux in the motor. As long as these phenomena have different characteristic frequencies, then it is possible to identify the underlying cause.
A quick recap on Motor Current Signature Analysis – MCSA
Motor Current Signature Analysis (MCSA) is a well-established technique, with over 30 years’ industrial application. It has mainly been used for identifying developing problems inside motors, particularly the development of defects in the rotor cage structure such as rotor bar cracking. MCSA is also sometimes referred to as Electrical Signature Analysis (ESA).
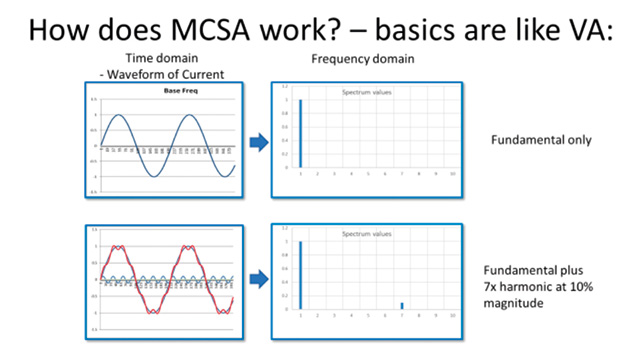
MCSA works by measuring the current drawn by an electric motor and analysing distortions on the current waveform. The key elements of MCSA involve creating and analysing a frequency spectrum of the current waveform.
If the waveform were perfectly sinusoidal, this spectrum would appear as a single peak at the line frequency only, as shown in the first row in Figure 1 (opposite page). Any distortions to the current waveform appear as additional peaks, at frequencies that are related to the characteristic frequency of the phenomenon causing the distortion, as shown in the second row in Figure 1.
By assessing the size of the additional peak and the frequency at which it occurs, it is possible to deduce the probable cause of the distortion and assess its severity.
Limitations on conventional MCSA – the impact of distorted voltage waveforms
Conventional MCSA works just by analysis of the current waveform. This can limit its ability to identify problems when the applied voltage waveform is itself distorted. The current drawn by a motor is not just affected by the behaviour of the motor and driven equipment system as described above, it is also strongly affected by the voltage applied to the motor.
So if you have a distorted voltage supply, you will inevitably expect some sort of distortion of the current waveform, although the shape will not directly match the voltage waveform because of the damping effects of the inductive windings. But if you did a frequency analysis of the current alone, it would show peaks associated with these voltage-induced distortions, and would give a misleading diagnosis.
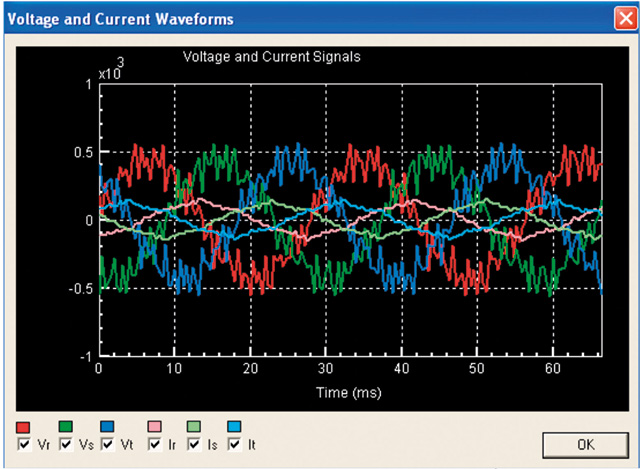
Distorted voltage waveforms are increasingly common in industrial environments, to a large extent resulting from the increasing use of inverters to provide variable speed control of motors. The inverter takes the normal mains supply at 50Hz in UK, converts it to DC, and then chops it up in pulses of varying width to simulate an AC supply of a different frequency. As shown in figure 2 (above), although the overall shape of the waveform may be quite a good approximation to a sinusoidal waveform, it can be highly distorted, with an awful lot of noise in the signal.
Notice how the distorted 3-phase voltages (the three larger, darker coloured traces) create distorted 3 phase currents (the smaller, paler traces). If conventional MCSA was carried out on these currents, there would be a mass of peaks at a wide range of frequencies, which would (spuriously) point to all sorts of faults with the rotating equipment.
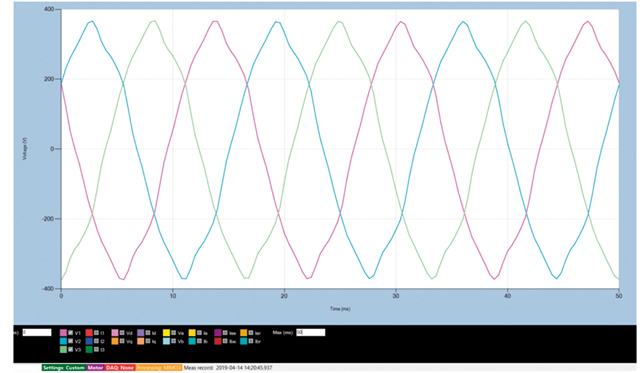
And it is not only inverter driven equipment that can see distorted voltages. Figure 3 (above) shows the three-phase voltage waveform taken from the supply to a fixed speed pump on a North Sea Oil Platform. This non-sinusoidal waveform contains large amplitudes of harmonic distortion that would tend to lead to misdiagnosis of faults with conventional, current-only, MCSA.
So with distorted voltages, it is essential to have a means of taking into account the distortions on the current that have been caused by distortions on the voltage waveform, and ignoring these, to focus only on the distortions that are associated with developing faults and other phenomena in the motor and driven equipment system.
Model-Based Voltage and Current Analysis (MBVI) – what is it?
Model-Based Voltage and Current (MBVI) Systems, such as the Faraday Predictive S200 system use a mathematical model of the relationship between current and voltage to pick out those distortions on the current waveform that have not been caused by distortions on the voltage waveform, and therefore must have come from the motor and driven equipment system.
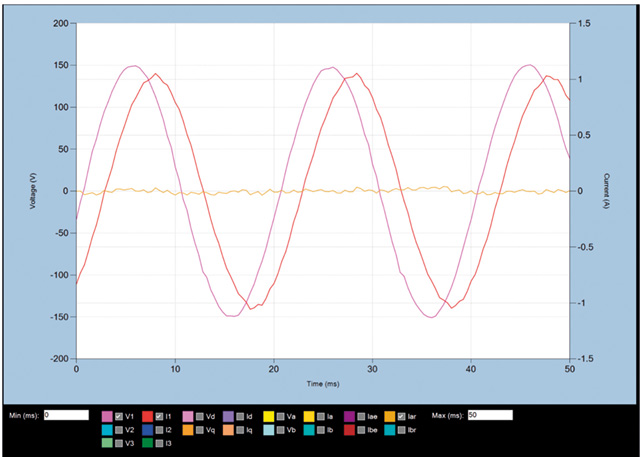
This is illustrated in figure 4 (above), which shows in pink the slightly distorted voltage waveform and in bolder red the rather more distorted current waveform. The orange line across the middle represents the distortions on the current waveform that have not been caused by distortions on the voltage waveform. Note that this residual current is based on voltage and current on all three phases, but only one phase of voltage and current is included in this plot for clarity.
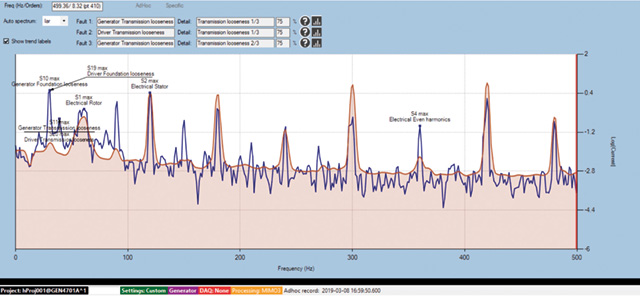
This residual current contains the information about the behaviour of the equipment, and is directly analogous to a raw vibration signal. By turning this time domain plot into a frequency spectrum, (see figure 5) it is possible to identify the frequency and magnitude of the distortions present, and by matching these frequencies against the characteristic frequencies for known faults, it is possible to identify the phenomena present in the equipment. And the magnitude of the signals indicates the severity of the faults. By trending these through time, developing faults can be studied, and predictions made about the time remaining before failure occurs.
Figure 5 shows that the system has automatically labelled some of the more significant peaks, but it will automatically identify peaks right across the spectrum including those not labelled, and uses all of this information to build up an overall picture of the equipment condition.
the fault types relevant to this equipment
The spectrum for this individual equipment can be compared against a normal, generic baseline for “typical” equipment (as shown in the brown shaded area) to give an indication of areas where this equipment is showing elevated signals compared to “typical” equipment.
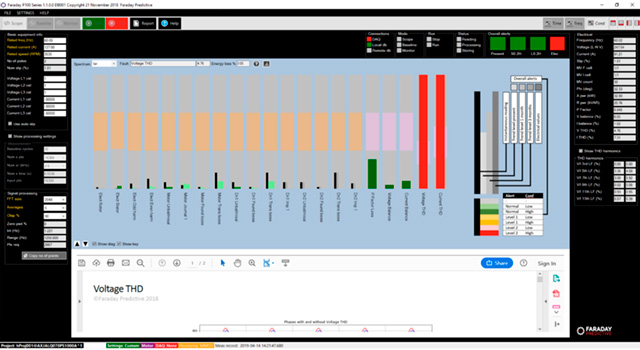
In addition, the system creates an automatically generated, equipment specific baseline for this equipment, which is then used to identify developing faults over time.
A summary of the faults, overall condition of the equipment, and the predicted state of each fault type and the equipment can then be given as a simple histogram plot, as shown in figure 6 (above).
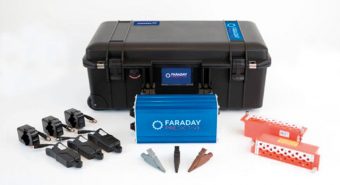
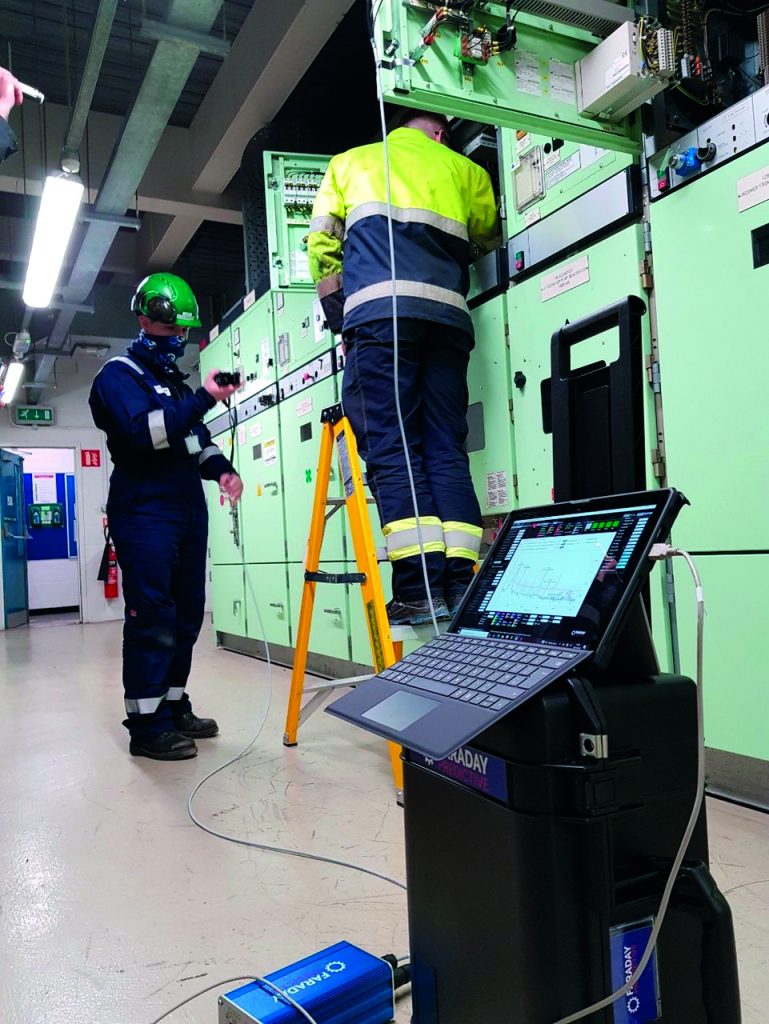
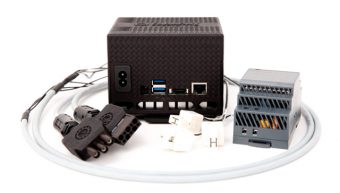
This sort of technology is available both in permanently installed versions, like the Faraday Predictive S200 series, as shown in figure 7 below, or in a portable kit like the Faraday Predictive P100 kit, shown in figure 8.
Connection of either the permanently installed kit or the portable kit is a simple matter of clipping threee split core current transformers (“CTs”) over the three phase cables inside the motor starter cabinet, as shown in figure 9, and attaching connections to each phase to pick up the voltage as shown in figure 10 (below).
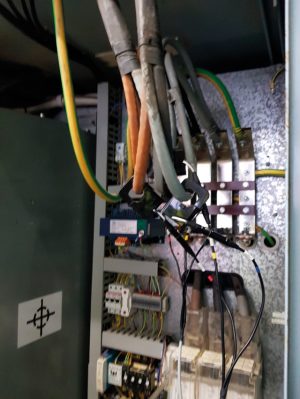
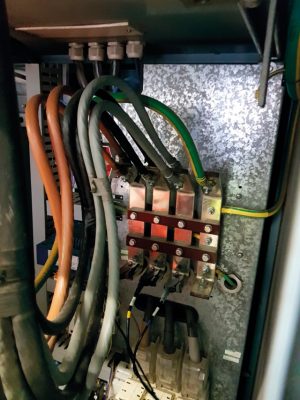
capture 3-phase voltage signals
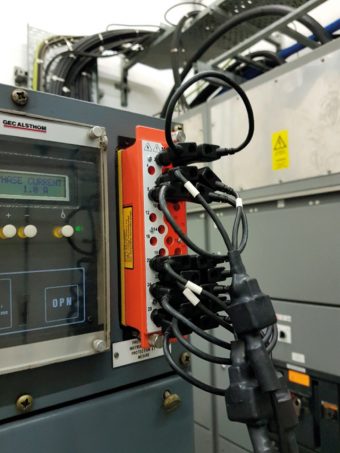
For the portable unit, this can also be done without even opening the motor cabinet by making use of existing connector blocks that are often fitted for testing motor protection systems. This is shown in figure 11 (below). The orange block and the associated cables are all supplied as part of the Faraday Predictive P100 kit and plug straight into the test block on the front of the motor starter panel. The leads take the current and voltage signals straight to the P100 unit.
Applicability
MBVI systems, both permanently installed or portable, can be used on almost any rotating equipment driven by electric motor. They are also equally applicable to generators, where they provide information not just on the generator but also the prime mover driving the generator.
Particular types of equipment where MBVI systems are most applicable are those where conventional Vibration Monitoring is difficult or impossible. This includes equipment that operates at varying loads, or varying speeds.
The MBVI systems can cope with this because they automatically measure both speed (from the supply frequency detected) and load (as a product of voltage x current), and normalise for both of these. They are particularly applicable for inaccessible equipment, such as submerged pumps, borehole pumps, in-tank pumps, in-duct fans, cryogenic equipment, or equipment in isolated locations, such as roof-mounted fans.
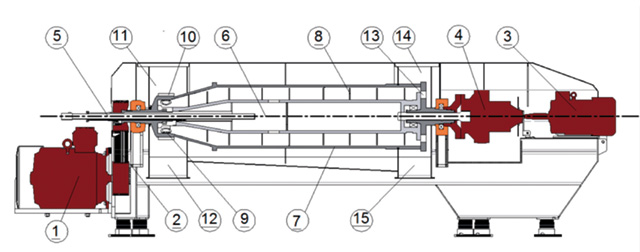
And there are also some types of equipment whose design itself makes conventional vibration monitoring very difficult, if not impossible. One interesting example is a centrifugal decanter, of a type used in among other places the food and drink industry. As shown in figures 12 and 13 (below), this consists of two concentric rotating elements, an outer “bowl” and an inner “scroll”, driven by separate motors, rotating at slightly different speeds. When in operation, the unit spins at high speed, creating up to 4000g to separate very fine materials out of suspension in the process liquid.
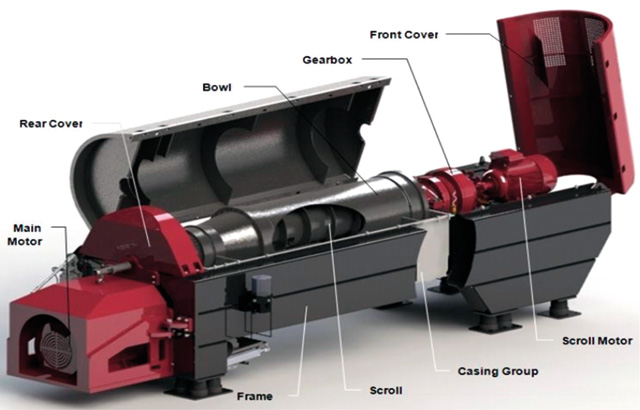
All of the rotating parts are enclosed in a housing, which cannot be opened whilst the equipment is running, so it is not possible to take vibration readings on bearing housings using hand held accelerometers. Worse than that, the inner scroll runs on bearings enclosed within the outer bowl which is itself rotating, so there is physically no way of taking vibration readings on these bearings.
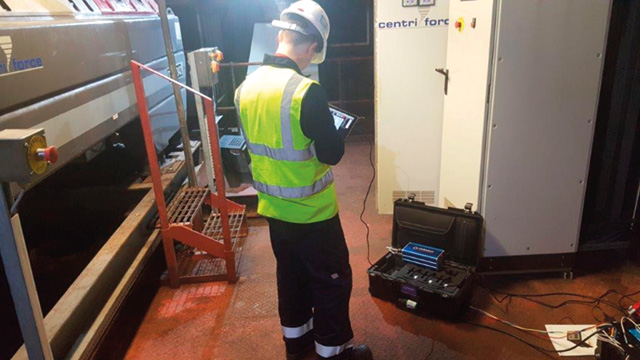
MBVI systems are able to examine this complex equipment, and identify bearing signals from each of the four main bearings, as well as investigating gearbox, belt drive, motor bearings, alignment, balance, etc. The Faraday Predictive portable P100 kit is shown in use on this equipment in figures 14 (below).
Conclusions
MBVI systems can be a powerful condition monitoring and diagnostic tool, for both permanently installed or portable solutions. They cover a broad range of equipment types and fault types, with a wider spread than Vibration Monitoring since they cover electrical and load related areas. They can work in areas that are not amenable to Vibration Monitoring, such as inaccessible equipment. And they also provide energy monitoring and energy optimisation information. But that is the topic for a future article. If you are interested in knowing more, Faraday Predictive are always pleased to talk.
Geoff Walker | Operations Director, Faraday Predictive info@faradaypredictive.com