

ABSTRACT
Rolling bearings are critical components used extensively in many types of plant and equipment, and if they fail unexpectedly can result in catastrophic failure with associated high repair and replacement costs. Consequently, vibration based condition monitoring has been used for many years to detect and diagnose machine faults and form the basis of a predictive maintenance strategy. This means that the early signs of deterioration can be identified during operation, enabling maintenance to be scheduled and operational costs reduced.
1.0 INTRODUCTION
Almost every type of rotating equipment uses rolling contact bearings to locate and allow accurate rotation of the shaft. During operation, equipment reliability is very dependent on the type of bearing selected as well as the precision of all associated components, i.e. shaft, housing, spacers, nuts etc. Bearing engineers generally use fatigue as the normal failure mode, on the assumption that the bearings are properly installed, operated and maintained. Due to improvements in manufacturing technology and materials, bearing fatigue life (which is related to sub-surface stresses) is not generally the limiting factor and probably accounts for less than 3% of failures in service.
All rolling element bearings produce vibration, which is an inherent feature of their design and operation, but the level of vibration – and, more importantly, whether it is likely to cause a problem – is dependent on many factors, including the bearing type. These include whether the bearing is required to operate in a noise sensitive environment, e.g. in household appliances, or whether a very high running accuracy is required, e.g. in the case of machine tool spindles. Excessive vibration can also put stress on other components within a system and lead to a shortened life or premature failure. Bearing vibration is therefore becoming increasingly important and both the reliability in operation and environmental factors must be taken into account.
Unfortunately though, many bearings fail prematurely in service because of contamination, poor lubrication, temperature extremes, poor handling and installation, incorrect fits, unbalance and misalignment. All these factors lead to an increase in bearing vibration and condition monitoring has been used for many years to detect degrading bearings before they catastrophically fail with the associated costs of downtime or significant damage to other parts of the machine.
Vibration monitoring has now become a well accepted and key part of many predictive maintenance regimes and relies on the well known characteristic vibration signatures which rolling bearings exhibit as the rolling surfaces degrade. However, many of these strategies fail to deliver their full potential because of the lack of investment in time, resource and training. Simply investing in condition monitoring equipment is not enough, this must be supported by investing in suitably qualified personnel and allowing them time to carry out the condition monitoring tasks, including the data analysis and appropriate training. Failure to do this will mean that the full benefits of a predictive maintenance strategy may not be realized.
Vibration is measured by mounting a sensor, usually on the housing or end cap, as close to the bearing as possible and ideally close to the load zone. In most situations, however, bearing vibration cannot be measured directly and the bearing vibration signature is modified by the machine structure, a situation that is further complicated by vibration from other equipment on the machine, i.e. electric motors, gears, belts, hydraulics, structural resonances etc. This often makes the interpretation of vibration data difficult and can in some situations lead to a misdiagnosis resulting in unnecessary machine downtime and costs. It is essential that time and resource are allocated in order to ensure a successful implementation. Alternatively, the monitoring service should be outsourced to a specialist service provider.
Here, the sources of bearing vibration will be discussed, along with the characteristic vibration frequencies that are likely to be generated. Several case studies will also presented showing how vibration based monitoring can be used to identify the early onset of faults and prevent untimely and costly failures in service.
2.0 SOURCES OF VIBRATION
A rolling contact bearing is a complex vibration system in which the components – i.e. rolling elements, inner raceway, outer raceway and cage – interact to generate complex vibration signatures. Although rolling bearings are manufactured using high precision machine tools and under strict cleanliness and quality controls, like any other manufactured part they will have degrees of imperfection and generate vibration as the surfaces interact through a combination of rolling and sliding contact. Although the amplitudes of surface imperfections are now in the order of nanometres, significant vibrations can still be produced in the entire audible frequency range (20Hz – 20kHz). The level of the vibration will depend upon many factors including the energy of the impact, the point at which the vibration is measured and the construction of the bearing.
2.1 Variable compliance
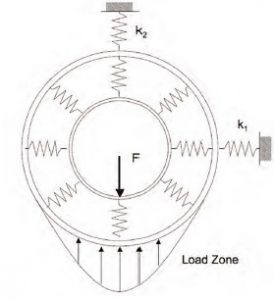
This occurs under radial or misaligned loads, is an inherent feature of rolling bearings, and is completely independent of quality. Radial or misaligned loads are supported by a few rolling elements confined to a narrow region, and the radial position of the inner ring with respect to the outer ring depends on the elastic deflections at the rolling element/raceway contacts (see Figure 1). The outer ring of the bearing is usually supported by a flexible housing which generally has asymmetric stiffness properties described by the linear springs of varying stiffness.
As the bearing rotates, the individual ball loads and hence the elastic deflections change to produce a relative movement between the inner and outer rings. The movement takes the form of a locus which is two dimensional and contained in a radial plane under radial load, while it is three dimensional under misalignment. The movement is also periodic, with a base frequency equal to the rate at which the rolling elements pass through the load zone. Frequency analysis of the movement yields the base frequency and a series of harmonics. Even a geometrically perfect bearing will therefore produce vibration because of the relative periodic movement between the inner and outer rings due to raceway elastic deflections. For a single row radial ball bearing with an inner ring speed of 1800rpm a typical ball pass rate is 100Hz and significant harmonics to more than 500Hz can be generated.
Variable compliance vibration is heavily dependent on the number of rolling elements supporting the externally applied loads; the greater the number of loaded rolling elements, the less pronounced the vibration. For radially loaded or misaligned bearings, ‘running clearance’ determines the extent of the load region, hence variable compliance generally increases with radial internal clearance. A distinction is made between ‘running clearance’ and radial internal clearance (RIC). When fitted to a machine, the former is normally smaller than the RIC due to differential thermal expansion and interference fit of the rings. In high speed applications, the effect of centrifugal force should also be considered.
Variable compliance vibration levels can be higher than those produced by roughness and waviness of the rolling surfaces. In applications where vibration is critical, however, it can be reduced to a negligible level by using ball bearings with the correct level of axial preload.
2.2 Geometrical imperfections
Because of the very nature of the manufacturing processes used to produce bearing components geometrical imperfections will always be present to varying degrees depending on the accuracy class of the bearing. For axially loaded ball bearings operating under moderate speeds the form and surface finish of the critical rolling surfaces are generally the largest source of noise and vibration. Controlling component waviness and surface finish during the manufacturing process is therefore critical since it may not only have a significant effect on vibration but also may affect bearing life.
2.2.1 Surface roughness
Surface roughness is a significant source of vibration when its level is high compared with the lubricant film thickness generated between the rolling element-raceway contacts. Under this condition surface asperities can break through the lubricant film and interact with the opposing surface, resulting in metal-to-metal contact. The resulting vibration consists of a random sequence of small impulses which excite all the natural modes of the bearing and supporting structure.
Surface roughness produces vibration predominantly at frequencies above 60 times the rotational speed of the bearing, thus the high frequency part of the spectrum usually appears as a series of resonances.
2.2.2 Waviness
For longer wavelength surface features, peak curvatures are low compared with that of the Hertzian contacts and rolling motion is continuous with the rolling elements following the surface contours. The relationship between surface geometry and vibration level is complex being dependent upon the bearing and contact geometry as well as conditions of load and speed. Waviness can produce vibration at frequencies up to approximately 300 times rotational speed but is usually predominant at frequencies below 60 times rotational speed. The upper limit is attributed to the finite area of the rolling element raceway contacts which average out the shorter wavelength features.
Even with modern precision machining technology waviness cannot be eliminated completely and an element of waviness will always exist albeit at relatively low levels. Not only the bearing itself but also the quality of the associated components can also affect bearing vibration, and any geometrical errors on the outside diameter of the shaft or bore of the housing can be reflected on the bearing raceways with the associated increase in vibration. Therefore, careful attention is required to the form and precision of all associated bearing components.
2.2.3 Discrete defects
Whereas surface roughness and waviness result directly from the bearing component manufacturing processes discrete defects refers to damage of the rolling surfaces due to assembly, contamination, operation, mounting, poor maintenance etc. These defects can be extremely small and difficult to detect and yet can have a significant impact on vibration critical equipment or can result in reduced bearing life. This type of defect can take a variety of forms: indentations, scratches along and across the rolling surfaces, pits, debris and particles in the lubricant.
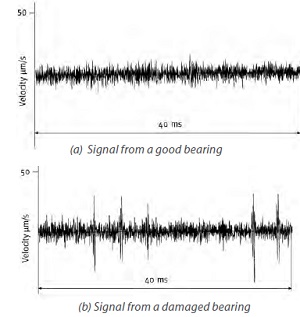
Bearing manufacturers have adopted simple vibration measurements on the finished product to detect such defects but these tend to be limited by the type and size of bearing. An example of this type of measurement is shown in Figure 2, where, in contrast to a good bearing, the discrete damage on a bearing outer ring raceway has produced a characteristically impulsive vibration which has a high peak/RMS ratio.
Where a large number of defects occurs, individual peaks are not so clearly defined, but the RMS vibration level is several times greater than that normally associated with a bearing in good condition.
3.0 BEARING CHARACTERISTIC FREQUENCIES
Although the fundamental frequencies generated by rolling bearings are related to relatively simple formulas they cover a wide frequency range and can interact to give very complex signals. This is often further complicated by the presence of other sources of mechanical, structural or electromechanical vibration on the equipment.
For a stationary outer ring and rotating inner ring, and from the bearing geometry, the fundamental frequencies are derived as follows:
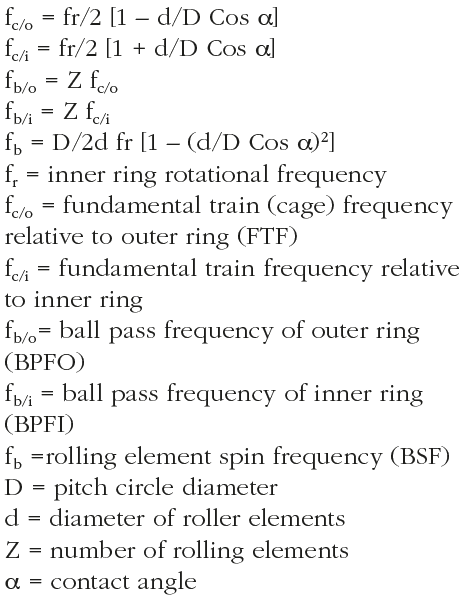
The bearing equations assume that no sliding contact occurs and that the rolling elements roll over the raceway surfaces. However, in practice this is rarely the case and due to a number of factors the rolling elements undergo a combination of rolling and sliding. As a consequence, the actual characteristic defect frequencies may differ slightly from those predicted, but this is highly dependent on the type of bearing, operating conditions and fits. Generally, the bearing characteristic frequencies will not be integer multiples of the inner ring rotational frequency, which helps to distinguish them from other sources of vibration.
Since most vibration frequencies are proportional to speed, it is important when comparing vibration signatures that data is obtained at identical speeds. Speed changes will cause shifts in the frequency spectrum, causing inaccuracies in both the amplitude and frequency measurement. In variable speed equipment spectral orders are sometimes used, where all the frequencies are normalized relative to the fundamental rotational speed. This is generally called “order normalization” where the fundamental frequency of rotation is called the first order.
Ball pass frequencies can be generated as a result of elastic properties of the raceway materials due to variable compliance, or as the rolling elements pass over a defect on the raceways. The frequency generated at the outer and inner ring raceway, respectively, can be estimated roughly as 40% (0.4) and 60% (0.6) of the inner ring speed times the number of rolling elements.
Unfortunately, bearing vibration signals are rarely straightforward and are further complicated by the interaction of the various component parts, but this can be often used beneficially in order to detect a deterioration or damage to the rolling surfaces.
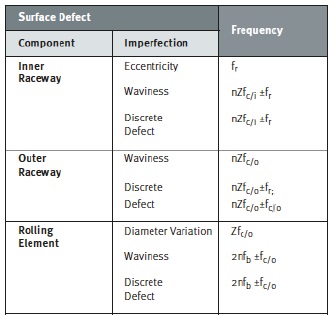
Imperfections on the surface of raceways and rolling elements, as a result of the manufacturing process, interact to produce other discrete frequencies and sidebands, which are summarised in Table 1.
Analysis of bearing vibration signals is usually complex and the frequencies generated will add and subtract and are almost always present in bearing vibration spectra. This is particularly true where multiple defects are present. Depending upon the dynamic range of the equipment, background noise levels and other sources of vibration, bearing frequencies can be difficult to detect in the early stages of a defect.
Over the years a number of diagnostic algorithms have been developed to detect bearing faults by measuring the vibration signatures on the bearing housing. These methods usually take advantage of both the characteristic frequencies and the ‘ringing frequencies’ (i.e. natural frequencies) of the bearing. This is described in more detail in Section 4.3.
3.1 Raceway defect
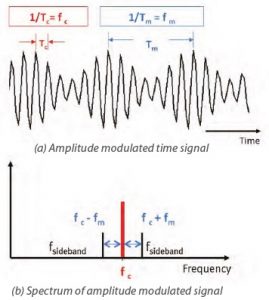
A discrete defect on the inner raceway will generate a series of high energy pulses at a rate equal to the ball pass frequency relative to the inner raceway (BPFI). Because the inner ring is rotating, the defect will enter and leave the load zone causing a variation in the rolling element-raceway contact force, hence deflections. While in the load zone the amplitudes of the pulses will be highest but then reduce as the defect leaves the load zone, resulting in a signal which is amplitude modulated at the inner ring rotational frequency. In the frequency domain this not only gives rise to a discrete peak at the carrier frequency (ball pass frequency) but also a pair of sidebands spaced either side of the carrier frequency by an amount equal to the modulating frequency, i.e. the inner ring rotational frequency (see Figure 3). As the level of amplitude modulation increases, the sidebands will generally also increase.
As the defect increases in size more sidebands are generated and at some point the ball pass frequency may no longer be generated, but instead a series of peaks spaced at the inner ring rotational frequency.
A discrete fault on the outer raceway will generate a series of high energy pulses at a rate equal to the ball pass frequency relative to the outer ring (BPFO). Because the outer ring is stationary the amplitude of the pulse will remain theoretically the same and will therefore appear as a single discrete peak within the frequency domain. However, an unbalanced rotor will produce a rotating load, so as with an inner ring defect, the resulting vibration signal can be amplitude modulated at inner ring rotational frequency. Likewise, the ball pass frequency can also be modulated at the fundamental train frequency. If a rolling element has a defect it will enter and leave the load zone at the fundamental train frequency, causing amplitude modulation and resulting in sidebands around the ball pass frequency. Amplitude modulation at the fundamental train frequency can also occur if the cage is located radially on the inner or outer ring.
Although defects on the inner and outer raceways tend to behave in the similar manner, for a given size defect the amplitude of the spectrum of an inner raceway defect is generally much smaller. The reasons for this might be that a defect on the inner ring raceway only enters the load zone once per revolution and the signal must travel through more structural interfaces before reaching the transducer location. The more difficult transmission path for an inner raceway fault probably explains why a fault on the outer raceway tends to be a little easier to detect.
Raceway defects can produce a series of high energy pulses which can then excite a natural frequency either of the bearing components or structural elements. This often takes the form of amplitude modulation, and results in difference frequencies related to either BPFO or BPFI. This can often be used beneficially to detect the early onset of a fault using envelope analysis (see Section 4.3).
3.2 Rolling element defect
Defects on the rolling elements can generate vibration at rotational frequency and twice rotational frequency. Twice the rolling element spin (rotational) frequency can be generated when the defect strikes both raceways, but sometimes the frequency may not be this high, because the ball is not always in the load zone when the defect strikes and energy is lost as the signal passes through other structural interfaces as it strikes the inner raceway. Also, when a defect on a ball is orientated in the axial direction it will not always contact the inner and outer raceway and therefore may not generate ball spin frequency (BSF) and be difficult to detect. If more than one rolling element is defective, sums of the ball spin frequency can be generated. If these defects are large enough, vibration at the fundamental train frequency can be generated.
Defects on rollers normally generate a frequency close to twice BSF with groups of spectral lines, the difference between the groups being twice BSF. Twice BSF may also be modulated by cage rotational speed resulting in sidebands at cage speed in the frequency spectrum. If the rolling elements are severally spalled, vibration at BSF may not be present, but overall vibration levels will be high.
3.3 Cage defect
As shown already, the cage tends to rotate at typically 0.4 times the inner ring speed, generally has a low mass and, therefore, unless there is a defect from the manufacturing process, cage-related vibrations are generally not discernable.
Unlike raceway defects, cage failures do not usually excite specific ringing frequencies and this limits the effectiveness of the envelope spectrum (see Section 4.3). In the case of cage failure, the signature is likely to have random bursts of vibration as the balls slide, the cage starts to wear or deform and a wide band of frequencies is likely to occur.
As a cage starts to deteriorate, for example as a result of inadequate lubrication, wear can start to occur on the sliding surfaces, i.e. in the cage pocket or, in the case of a ring guided cage, on the cage guiding surface. This may gives rise to a less stable rotation of the cage or a greater excursion of the rolling elements, resulting in increased sideband activity around the other bearing fundamental frequencies, e.g. ball spin frequency.
Excessive clearance can cause vibration at the fundamental train frequency (FTF) as the rolling elements accelerate and decelerate through the load zone, which can result in large impact forces between the rolling elements and cage pockets. Also, outer raceway defects and roller defects can be modulated with the FTF fundamental frequency.
3.4 Other sources of vibration
Contamination is a very common source of bearing deterioration and premature failure and is due to the ingress of foreign particles, either as a result of poor handling or during operation. By its very nature the magnitude of the vibration caused by contamination will vary and in the early stages may be difficult to detect, but this depends very much on the type and nature of the contaminants. Contamination can cause wear and damage to the rolling contact surfaces and generate vibration across a broad frequency range. In the early stages the crest factor of the time signal will increase, but it is unlikely that this will be detected in the presence of other sources of vibration.
With grease lubricated bearings, vibration may be initially high as the bearing ‘works’ and distributes the grease. The vibration will generally be irregular but will disappear with running time and generally does not present a problem for most applications. For noise critical applications special greases with low noise characteristics are often used.
3.5 Bearing speed ratio
The bearing speed ratio (ball pass frequency divided by the shaft rotational frequency) is a function of the bearing loads and clearances, and can therefore give some indication of the bearing operating performance.
When abnormal or unsatisfactory lubrication conditions are encountered, or when skidding occurs, the bearing speed ratio will deviate from the normal or predicted values. If it is below predicted values this may indicate insufficient loading, excessive lubrication or insufficient bearing radial internal clearance, which could result in higher operating temperatures and premature failure. Conversely, a higher than predicted ratio may indicate excessive loading, excessive bearing radial internal clearance or insufficient lubrication.
For an experienced analyst, vibration can be used not only to detect deterioration in bearing condition but also to make an initial assessment of whether the equipment is operating satisfactorily at initial start-up.
In electrical machines, two deep groove radial ball bearings are commonly used to support the shaft; one is a locating bearing while the other is a non-locating bearing that can be displaced in the housing to compensate for axial thermal expansion of the shaft. It is not unusual for bearings to fail catastrophically due to thermal pre-loading or cross-location where there is insufficient clearance between the bearing outer ring and housing resulting in the non-locating or ‘floating’ bearing failing to move in the housing, i.e. the bearings become axially loaded. The effect of this axial load is to increase the operating contact angle, which in turn increases the BPFO. For a ball bearing, the contact angle can be estimated from the expression
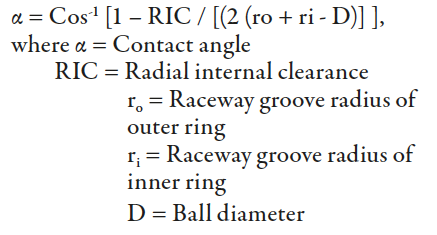
Since a radial ball bearing is designed to have a radial internal clearance in the unloaded condition, it can also experience axial play. Under an axial load, this results in the ball/raceway contact having an angle other than zero. As the bearing radial internal clearance and thus the axial play increases, so does the contact angle. For a correctly assembled motor under pure radial load, the contact angle will be zero and the BPFO will be given by the expression
![]()
On the other hand, if cross-location occurs (the outer ring cannot move in the housing) the bearing radial internal clearance will be lost by the relative axial movement between the inner and outer rings, the bearings become axially loaded and the BPFO will increase due to the increase in contact angle. The amplitude of the BPFO is likely to be small until the bearing becomes distressed and it may not always be possible to detect the BPFO, particularly if using a linear amplitude scale. A log or dB amplitude scale may be better, but care should also be exercised here because there may be other frequencies that may be close to the BPFO.
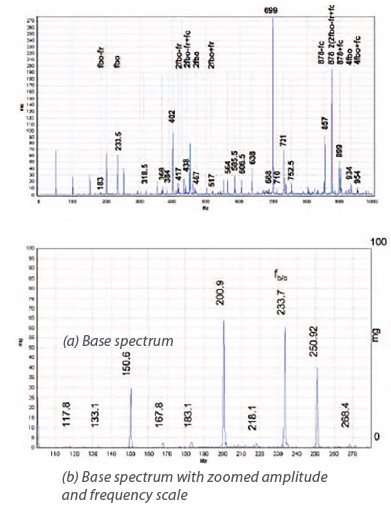
A good example of how the bearing speed ratio can be used to identify a potential problem is given in Figure 4, which shows a vibration acceleration spectrum measured axially at the drive end (DE) on the end cap of a 250kW electric motor. The measurements were obtained during a “run-up” test prior to installation in the plant.
For a nominal shaft speed of 3000 rpm (50Hz) the calculated BPFO of the DE bearing was 228.8Hz, giving a bearing speed ratio of 4.576. Of particular note in Figure 4(b) is the vibration at around 233.7Hz, which is close to the calculated BPFO and gives a bearing speed ratio of 4.67 – an increase of 2%. A BPFO of 233.7Hz corresponds to a contact angle of 25° and would indicate that the type 6217 bearing was subject to a high axial load. If correct, the most probable reason was that the bearing had been installed too tightly in the housing and could not move axially to compensate for axial thermal expansion of the shaft.
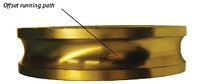
Shortly after installation, the motor failed catastrophically. Figure 5, a photograph of the inner ring, shows the ball running path offset from the centre of the raceway towards the shoulder, indicating the presence of high axial loads.
After a thorough investigation of all the bearing fits it was confirmed that there was insufficient clearance between the outer ring and the housing of the non locating bearing, resulting in cross-location (axial loading) which was consistent with the vibration measurements taken prior to installation.
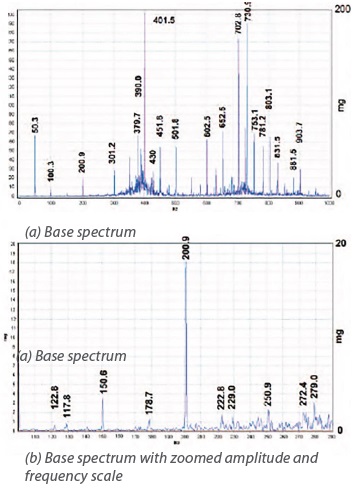
A number of harmonics and sum and difference frequencies relating to the BPFO (233.5Hz), cage rotational frequency (21Hz) and inner ring rotational frequency are also evident in the Figure 4 spectrum. Once the motor had been rebuilt with new bearings and the correct bearing fits, the “run-up” test was repeated prior to installation (see Figure 6).
The base spectrum shows no characteristic bearing frequencies, but when both the amplitude and frequency scales are expanded a discrete peak at 229Hz becomes evident (see Figure 6(b)), which matches very closely with the predicted BPFO of 228.8Hz. This motor went on to operate successfully.
4.0 VIBRATION MONITORING
Vibration monitoring is probably the most widely used predictive maintenance technique and, with few exceptions, can be applied to a wide variety of rotating equipment. Since the mass of the rolling elements is generally small compared to that of the machine the velocities generated are generally small and result in even smaller movements of the bearing housing, making it difficult for the vibration sensor to detect.
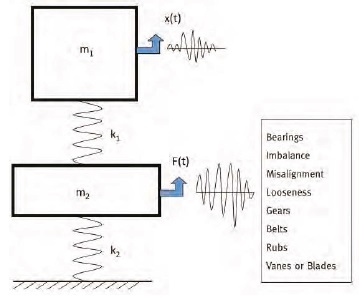
Machine vibration comes from many sources, e.g. bearings, gears, unbalance etc., and even small amplitudes can have a severe effect on the overall machine vibration depending on the transfer function, damping and resonances (see Figure 7). Each source of vibration will have its own characteristic frequencies and can manifest itself as a discrete frequency or as a sum and/or difference frequency.
At low speeds, less than 60rpm, it is still possible to use vibration monitoring, but a greater degree of care and experience is required and other techniques, such as measuring shaft displacement or Acoustic Emission (AE), may yield more meaningful results although the former is not always easy to apply. Furthermore, AE may detect a change in condition but has limited diagnostic capability. Vibration is used successfully on wind turbines where the main rotor speed is typically between 5 and 30 rpm. In a wind turbine, there are two main groups of vibration frequencies generated – gear mesh and bearing defect frequencies. This can result in complex vibration signals, which can make frequency analysis a formidable task. However, techniques such as enveloping (see Section 4.3), which has a high sensitivity to faults that cause impacting, can help reduce the complexity of the analysis. Bearing defects can excite higher frequencies, which can be used as a basis for detecting incipient damage.
Vibration measurement can generally be characterised as falling into one of three categories – detection, diagnosis and prognosis. Detection generally uses the most basic form of vibration measurement, where the overall vibration level is measured on a broadband basis in a range, for example, of 10-1000Hz or 10-10000Hz. In machines where there is little vibration other than from the bearings the spikiness of the vibration signal indicated by the Crest Factor (peak/RMS) may imply incipient defects, whereas the high energy level given by the RMS level may indicate severe defects.
This type of measurement generally gives limited information (other than to an experienced operator) but can be useful for trending, where an increasing vibration level is an indicator of deteriorating machine condition. Trend analysis involves plotting the vibration level as a function of time and using this to predict when the machine must be taken out of service for repair or at least a more in depth survey must be performed. Another way of using the measurement is to compare the levels with published vibration criteria for different types of equipment.
Although broadband vibration measurement may provide a good starting point for fault detection, it has limited diagnostic capability and, while a fault may be identified, it may not give a reliable indication of where the fault lies – in bearing deterioration/damage, unbalance, misalignment, or gear defects, etc. Where an improved diagnostic capability is required, frequency analysis is normally employed, which usually gives a much earlier indication of the development of a fault and also of its source.
Having detected and diagnosed a fault, it is much more difficult to give a prognosis of the remaining useful life and of how and when the machine or equipment will fail. This often relies on continued monitoring of the fault, to determine a suitable time when the equipment can be taken out of service, and/or on experience with similar problems.
In general, rolling bearings produce very little vibration when they are free of faults and have distinctive characteristic frequencies when faults develop. A fault that begins as a single defect, such as a spall on a raceway, is normally dominated by impulsive events at the raceway pass frequency, resulting in a narrow band frequency spectrum. As the damage increases, there is likely to be an increase in the characteristic defect frequencies and sidebands, followed by a drop in these amplitudes and an increase in the broadband noise with considerable vibration at shaft rotational frequency. Where machine speeds are very low the bearings generate low energy signals, which may also be difficult to detect. Furthermore, bearings located within a gearbox can be difficult to monitor because of the high energy at the gear meshing frequencies, which can mask the bearing defect frequencies.
4.1 Overall vibration level
This is the simplest way of measuring vibration and usually involves measuring the RMS (Root Mean Square) vibration of the bearing housing or of some other point on the machine, with the transducer located as close to the bearing as possible. The vibration is measured over a wide frequency range, such as 10-1000Hz or 10-10000Hz. The measurements can be trended over time and compared with known levels of vibration, or pre-alarm and alarm levels can be set to indicate a change in the machine condition. Alternatively, measurements can be compared with general standards. Although this method represents a quick and low cost method of vibration monitoring, it is less sensitive to incipient defects, i.e. it is only really suitable for detecting defects in an advanced condition and has limited diagnostic capability. It is also easily influenced by other sources of vibration, such as unbalance, misalignment, looseness, electromagnetic vibration etc.
In some situations, the Crest Factor (Peak-to-RMS ratio) of the vibration is capable of giving an earlier warning of bearing defects. As a local fault develops, this produces short bursts of high energy, which increase the peak level of the vibration signal but have little influence on the overall RMS level. As the fault progresses, more peaks will be generated until finally the Crest Factor decreases but the RMS vibration increases. The main disadvantage of this method is that, in the early stages of a bearing defect, the vibration is normally low compared with other sources of vibration present and is therefore easily influenced, so any changes in bearing condition are difficult to detect.
4.2 Frequency spectrum
Frequency analysis plays an important part in the detection and diagnosis of machine faults. In the time domain the individual contributions such as unbalance, or from bearings, gears etc., to the overall machine vibration are difficult to identify. In the frequency domain, they become much easier to identify and can therefore be much more easily related to individual sources of vibration.
It is not always possible to rely on the amplitude of bearing discrete frequencies to indicate defect severity, because each machine will have different mass, stiffness and damping properties. Even identical machines can have different system properties and this can affect the amplitudes of bearing defects of similar size. It is often the pattern of the bearing defect frequencies that is most significant in determining the defect severity. The number of bearing related harmonic frequencies, frequency sidebands and characteristic features within the time waveform data can be much more reliable than amplitude alone as a method of determining when action needs to be taken.
As already discussed, a fault developing in a bearing will show up as increasing vibration at frequencies related to the bearing characteristic frequencies, making detection possible at a much earlier stage than with overall vibration.
4.3 Envelope spectrum
When a bearing starts to deteriorate the resulting time signal often exhibits characteristic features that can be used to detect a fault. Furthermore, bearing condition can rapidly progress from the presence of a very small defect to complete failure in a relatively short period of time, so early detection requires sensitivity to very small changes in the vibration signature. As already discussed, the vibration signal from the early stage of a defective bearing may be masked by machine noise, making it difficult to detect the fault by spectrum analysis alone.
The main advantage of envelope analysis is its ability to extract the periodic impacts from the modulated random noise of a deteriorating rolling bearing. This is even possible when the signal from the rolling bearing is relatively low in energy and ‘buried’ within other vibration from the machine.
Like any other structure with mass and stiffness the bearing inner and outer rings have their own natural frequencies which are often in the kilohertz range. However, it is more likely that the natural frequency of the outer ring will be detected due to the small interference or clearance fit in the housing.
If there is a fault on the outer ring, the natural frequency of the ring may be excited as the rolling element hits the fault and this will result in a high frequency burst of energy which decays and is then excited again as the next rolling element hits the defect. In other words, the resulting time signal will contain a high frequency component amplitude modulated at the ball/roller pass frequency of the outer raceway. In practice this vibration will be very small and almost impossible to detect in a base spectrum, so a method of enhancing the signal is required.
By removing the low frequency components through a suitable high pass filter, rectifying the output and then using a low pass filter, this leaves the envelope of the signal whose frequency corresponds to the repetition rate of the defect. This technique is often used to detect early damage in rolling element bearings and is also often referred to as the High Frequency Resonance Technique (HFRT) or Envelope Spectrum.
5.0 CASE HISTORIES
The following three histories are derived from actual investigations of roller bearings in traction motors and gearboxes in electrically powered trains – Electrical Multiple Units or EMUs. Vibration signals from these types of equipment can be very complex, as they often contain a number of different bearing types and gears, which can include multistage planetary systems. At times, this can make the detection and diagnosis of a problem very difficult and often several different techniques may have to be used to diagnose a problem.
5.1 Railway vehicles
Improving the reliability of railway rolling stock is becoming increasingly important and the use of remote condition monitoring is receiving much attention. At present, these types of systems are often expensive to install and interpreting the data can be difficult, other than to the trained specialist. As a result, work has been carried out to determine whether depot-based vibration measurements can be used to assess the condition of the drive system (traction motor and reduction gearbox) of passenger trains without the need to remove them from the bogie.
Traction motors are used to power the wheel set of EMUs, which require no separate locomotive, as motors are incorporated within one or more carriages and drive to the wheel set is normally achieved through a reduction gearbox.
Although remote monitoring has the potential to offer real-time on-line monitoring, assessing the condition of the traction motor and gearbox while the train is in service, or without removal from the bogie, is very difficult and costly. Consequently, it was decided to investigate whether a depot-based vibration measurement, using an under-floor wheel lathe to rotate the wheel set, could be used to assess the condition of the traction motor and gearbox. Under-floor wheel lathes are used by fleet operators to maintain the condition of the wheel tread by allowing machining of wheel profiles without the need to remove them from the vehicle.
Wheel lathes generally operate between 60-100m/min, so a wheel diameter of 800mm will have a speed of between 24 and 40rpm. Thus for a typical reduction gearbox ratio of 4:1 the traction motor speed would be between 96rpm and 160rpm. The big advantage of this type of measurement is that it allows the condition of the transmission system to be easily assessed during routine wheel turning. This makes the whole process extremely simple and cost-effective without the need for large capital investment, installation of equipment or extensive training.
5.1.1 Case history 1: traction motor, train A
A 250kW traction motor provided power to the wheels of a passenger train EMU via a 4.15:1 reduction gearbox. After positioning the train over a wheel lathe, vibration measurements were obtained by attaching an accelerometer to the traction motor housing and rotating the wheel set. The motor had a Type 6016 ball bearing at the drive end and a type NU210 cylindrical roller bearing at the non-drive end. Vibration data obtained from the drive end of the motor housing is shown in Figure 8. In this case the wheel lathe was operated at 60m/min, and although the exact diameter of the wheel tread was not recorded, maintenance records showed that it was approximately 800mm. This would give a wheel speed of 24rpm (0.4Hz) and a traction motor speed of 99rpm (1.65Hz).
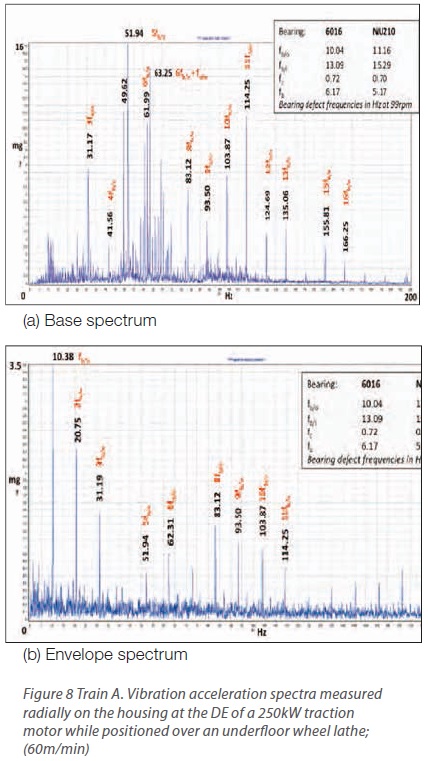
Based on the surface speed of 60m/min the calculated BPFO of the 6016 bearing is 10.04Hz and the base spectrum, Figure 8(a), shows a peak at 31.17Hz – this corresponds to the third harmonic of 10.39Hz (31.17/3) and is very close to the calculated BPFO. The fifth and eleventh harmonic are particularly dominant, with harmonics present up to the fifteenth.
Given that the surface speed of the lathe was not accurately measured, but set manually using a rotary dial, the vibration at 10.39Hz corresponds very closely with the calculated BPFO and corresponds to a surface speed of 62m/min. The large number of 1.24Hz sidebands around the sixth harmonic of BPFO is thought to be related to the wheel lathe drive wheel which makes contact with the wheel tread to provide rotation of the wheel set. The exact diameter of the wheel lathe drive wheel was not known but was approximately 220mm, which would give a rotational speed of 86rpm or 1.43Hz (fsdw = 0.22 x 3.142/60).
The envelope spectrum, Figure 8(b), contains a dominant peak at 10.38Hz, which corresponds to the BPFO of the type 6016 ball bearing with significant harmonics being present.
The presence of BPFO and the high number of harmonics in the spectra suggest that serious damage/deterioration is present on the outer ring raceway of the 6016 ball bearing. The high number of harmonics strongly suggests that damage may be present at several positions around the bearing outer ring raceway. With a single area of discrete damage the number of significant harmonics is likely to be much lower.
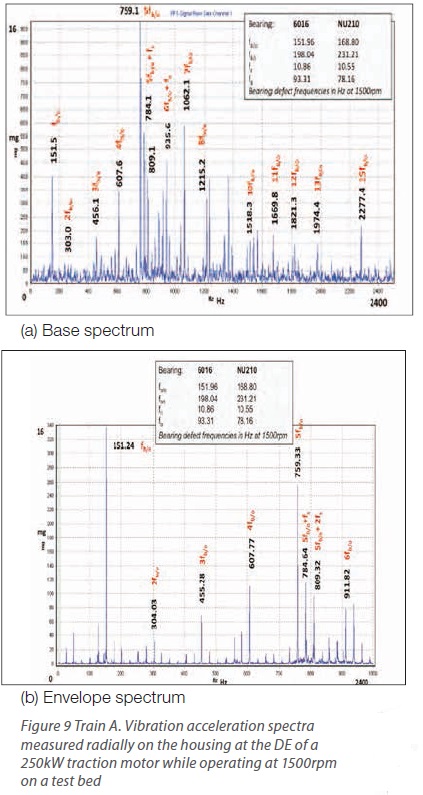
Vibration measurements obtained from the wheel lathe contain vibrations from many other sources – gearbox, axle box, interaction between the lathe drive wheel and wheel tread, etc, – which can make interpretation of the vibration data very difficult. Also, when removing bearings from the traction motor during the disassembly process some damage to the bearings may occur. Therefore, in order to verify the diagnosis of an outer ring raceway defect, and to provide a more accurate assessment of bearing condition, the motor was removed from the bogie, run on a test bed at 1500rpm and vibration measurements obtained from the traction motor housing.
Figure 9 shows vibration measurements obtained from the DE of the traction motor housing and the base spectrum, Figure 9(a), is dominated by vibration at 151.24Hz and a significant number of harmonics. This corresponds very closely with the calculated BPFO of 151.96Hz for the 6016 ball bearing. The fifth harmonic of BPFO is very dominant, which was the case for the on-train measurement [Figure 8 (a)]. Sidebands at shaft speed (fs = 25Hz) are clearly evident. Once again, the high number of harmonics of BPFO indicates a major deterioration in the condition of the outer ring raceway and confirms the on-train measurements. The envelope spectrum, Figure 9(b), also shows clear evidence of an outer ring raceway defect with a dominant peak at BPFO and a number of harmonics.
After removal from the motor, the bearings were examined for signs of deterioration and damage. A photograph of the outer ring raceway and rolling elements is shown in Figure 10. Damage to the outer ring raceway – in the form of a large spall – is clearly visible in the centre of the raceway, with the start of further damage just to the left of the main spall. Apart from one rolling element which had a single spall, the remainder were in reasonable condition and capable of further running.
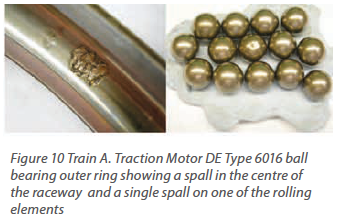
There was no evidence of high axial load, which might have explained the spalling of the rolling element, so the most probable cause of the damage is electrical erosion. If left undetected, this level of damage may have resulted in a catastrophic failure of the motor, with possible disruption to operation in service.
5.1.2 Case History 2: traction motor in high-speed train B
Vibration measurements were obtained from the (8MW) traction motors of a high-speed passenger train to prevent premature failures and improve reliability in service. A 510kW traction motor was used to power the wheel set via a 3.0331 reduction gearbox. The traction motor had a Type 6016 ball bearing at the drive end and a type NU210 cylindrical roller at the non-drive end. Vibration measurements were obtained from the traction motor housing by rotating the wheel set on a wheel lathe at a wheel surface speed of 100m/min. The wheel diameter was approximately 920mm, the gearbox ratio of 3.033:1 giving a wheel speed of 34.6rpm (0.577Hz) and traction motor rotational speed of 104.92rpm (1.75Hz). The wheel lathe drive wheel diameter was 215mm, giving a rotational speed of 148.03rpm (2.47Hz).
5.1.2.1 Coach 1
Vibration spectra obtained radially from the DE of the traction motor housing are shown in Figure 11.
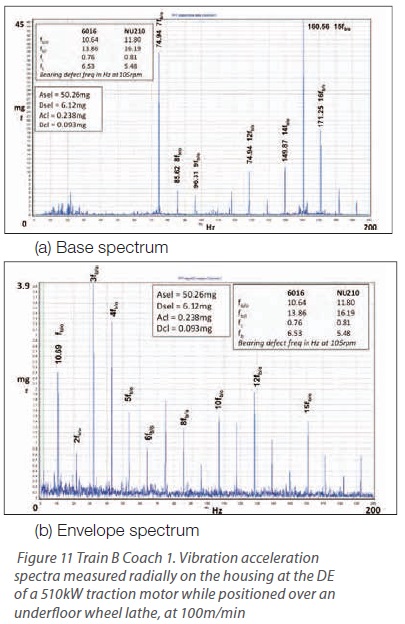
The calculated BPFO of the 6016 ball bearing is 10.64Hz and the base spectrum, Figure 11(a), exhibits a significant number of discrete frequencies which correspond to the BPFO. Harmonics of BPFO are present with the seventh (74.94Hz) and fifteenth (160.56Hz) harmonic being particularly dominant. This gives a measured BPFO of 10.70Hz compared to the calculated value of 10.64Hz. It is important to note the absence of any of the lower harmonics of BPFO, and that at least the first five, preferably the first ten, harmonics of the bearing characteristic frequencies should always be considered in any analysis.
Significant harmonics of BPFO are also present in the envelope spectrum – see Figure 11(b). The magnitude and distribution of the defect frequency and its harmonics indicate that some major deterioration of the bearing outer ring raceway has occurred and some immediate action is required in order to mitigate the risk of a failure in service. In order to confirm the suspected bearing damage, after removing the traction motor from the train, it was run at 3000rpm on a test bed – see Figure 12.
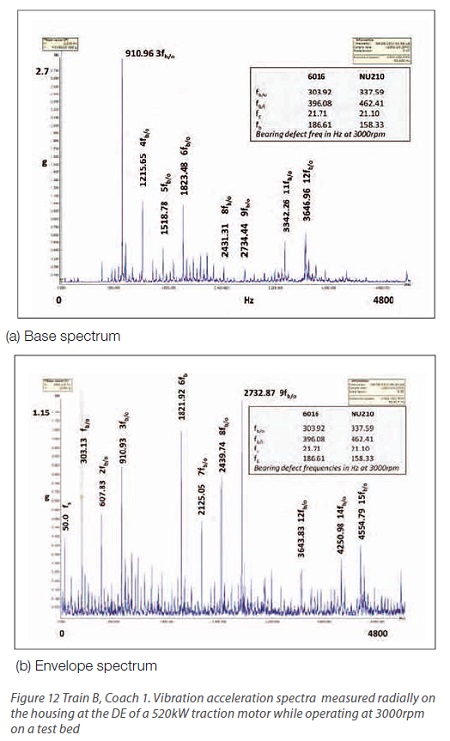
The base spectrum, Figure 12(a), is dominated by vibration at 910.96Hz, which corresponds with the third harmonic of BPFO of the 6016 ball bearing. A large number of harmonics of BPFO are also present with sidebands at motor rotational speed (50Hz), although the amplitudes are relatively small. Likewise, the envelope spectrum is rich in harmonics of BPFO of the 6016 bearing with the sixth (1821.92Hz) and ninth harmonic (2732.87Hz) being dominant. Motor vibration measurements on the test bed correlate well with measurements obtained from the wheel lathe and confirm that serious damage is present on the outer ring raceway of the Type 6016 ball bearing.
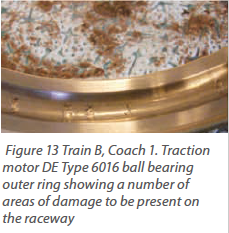
Figure 13 shows the bearing outer ring raceway, where multiple areas of damage are present in the centre. Electrical erosion is thought to be a major factor in the damage, although one of the rolling elements had a circumferential groove on the surface which may have been caused by either Figure 13 Train B, Coach 1. Traction high axial load motor DE Type 6016 ball bearing or contamination outer ring showing a number of trapped between the areas of damage to be present on rolling element and the raceway cage pocket.
After the bearings were replaced the motor was re-installed on the bogie and the vibration measurements repeated on the wheel lathe. Figure 14 shows the vibration spectra for the overhauled motor where there is no significant vibration related to the bearing defect frequencies.
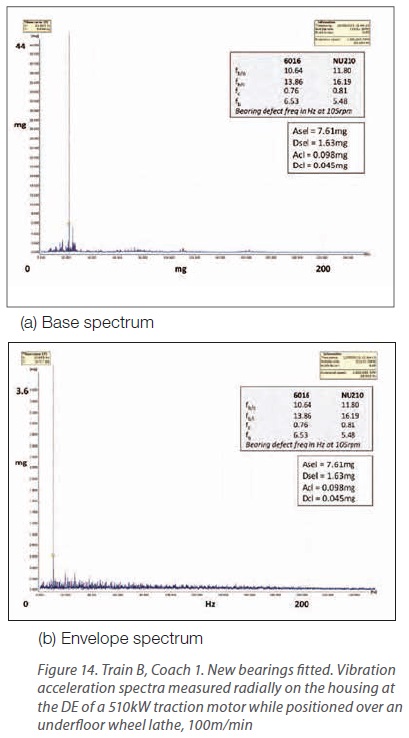
Also, note that the four characteristic values – Asel, Dsel, Acl and Dcl – have decreased significantly on the motor postoverhaul compared to pre-overhaul – see Figures 11 and 14. For example, Asel and Dsel prior to overhaul were 50.26mg and 6.12mg respectively, which decreased to 7.61mg and 1.63mg respectively post- overhaul. This represents reductions of greater than 80% in the characteristic values. Note that the characteristic values Asel and Dsel relate to the RMS of the raw and demodulated signal and Acl and Dcl to the average value of the raw and demodulated spectrum.
Sometimes, even simply based vibration parameters, such as, RMS Raw and RMS Envelope (RMS of demodulated signal) can be used to successfully indicate a developing fault and give advanced warning before a catastrophic failure occurs. Table 2 shows the characteristic values measured over the frequency range 0-1kHz and, as with the frequency range 0-200Hz (see Figures 11 and 14) show a signifi cant reduction of around 80% after replacing the bearings.
5.1.2.2 Coach 2
Another example of vibrations measurements obtained from the traction motor of a high speed train (Train B) is shown in Figure 15.
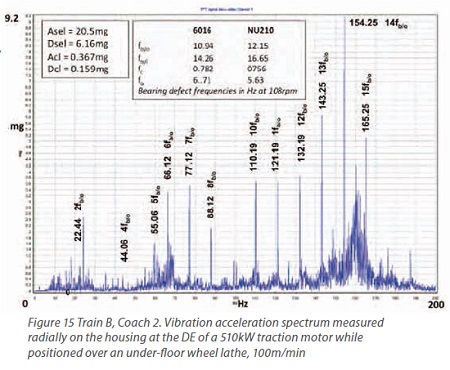
In this case the wheel rotational speed was 108rpm, giving a calculated BPFO of 10.94Hz for the 6016 ball bearing. Significant harmonics of BPFO are present in the spectrum, which is dominated by vibration at the fourteenth harmonic (14fb/o = 154.25Hz). This suggests some serious deterioration has occurred in the condition of the bearing outer ring raceway with multiple areas of damage. After removal from the train, the traction motor was run at 3000rpm on a test bed at the Motor Rewinder – see Figure 16.
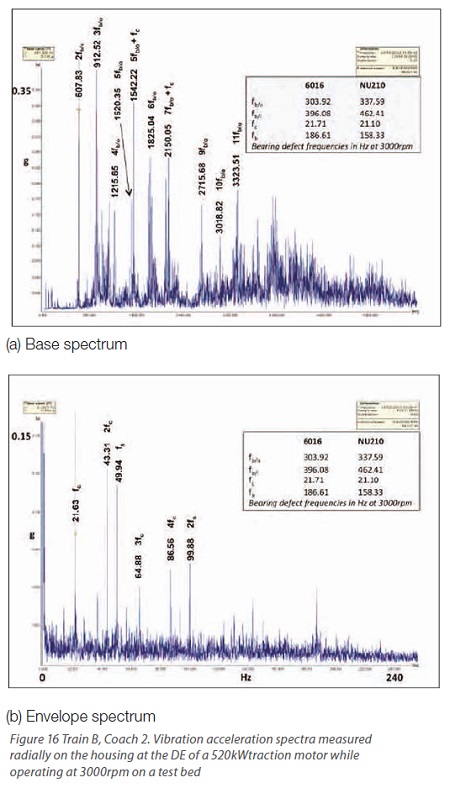
The calculated BPFO of the 6016 bearing is 303.92Hz and the base spectrum, Figure 16(a), shows a number of harmonics with a dominant vibration at the second (607.83Hz) and the third (912.52Hz) harmonic with significant harmonics present up to the eleventh. One of the most significant characteristics of this spectrum is the presence of sidebands at cage speed (fc=21.7Hz) around the fifth and seventh harmonic of BPFO. High amplitude vibrations at 1542.22Hz and 2150.05Hz correspond with the fifth and seventh harmonics of BPFO plus cage rotational speed. This is unusual, and normally a sign that some serious deterioration has occurred to the bearing rolling surfaces, in particular that either the rolling elements and/or cage have been damaged or deteriorated. Further confirmation of this can be seen in the envelope spectrum, Figure 16(b), where a number of harmonics of cage speed (fc=21.63Hz) are clearly evident, the second harmonic being particularly dominant with the third and fourth harmonics also present. The envelope spectrum also shows a large discrete peak at 49.94Hz, which is shaft rotational speed (fs = 49.94Hz) and indicates that the vibration signal is modulated at shaft rotational speed.
When present, vibration at cage speed is normally associated with serious bearing damage/ deterioration, either of the rolling elements or of the cage, which often means that immediate action is required to replace the bearings or catastrophic failure may occur.
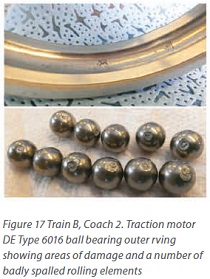 On inspection of the bearing (see Figure 17) the outer ring raceway had a number of areas of damage and a number of the rolling elements were badly spalled.
The main reason for this failure is thought to be excessive axial load, which caused the rolling elements to ‘ride over’ the shoulder of the outer ring raceway. It is also thought that electrical erosion may be partly to blame.
5.1.3 Case History 3: traction motor, train C
5.1.3.1 Coach 1
In this example the train was a light railway vehicle with a DC traction motor which had a type NUP217 cylindrical roller bearing at the DE and a type NU217 cylindrical roller bearing at the NDE, and provided power to the wheel set via a 5.667:1 reduction gearbox.
The train was positioned over a wheel lathe and vibration measurements obtained at a wheel surface speed of 100m/min. The wheel diameter was approximately 740mm, the gearbox ratio 5.667:1 resulting in a wheel speed of 43rpm (0.72Hz) and traction motor rotational speed of 243rpm (4.05Hz). The diameter of the wheel lathe drive wheel was 255mm, giving a rotational speed of 124.81rpm (2.08Hz).
The vibration spectrum obtained from the noncommutator (fan end) of the traction motor housing while positioned over the wheel lathe is shown in Figure 18.
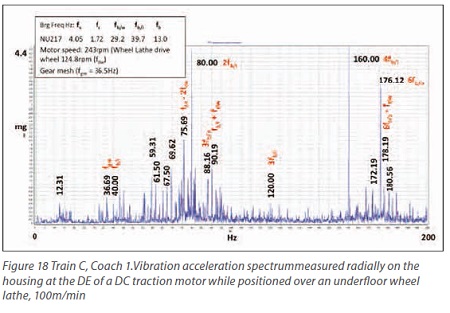
The calculated defect frequencies for the NU217 bearing are shown in Figure 18 for a rotational speed of 243rpm. The calculated inner raceway defect frequency (BPFI) of the NU217 bearing is 39.7Hz and the spectrum shows a dominant discrete frequency at 80Hz and 160Hz, which correspond to the second and fourth harmonics of BPFI respectively. Vibration at BPFO is also present with the sixth harmonic (176.12Hz) being particularly noticeable. Sidebands at 2.08Hz show the signal to be modulated at the wheel lathe drive wheel speed (fdw). The gear mesh frequency of 36.69Hz is also present but there are no significant harmonics or sidebands, indicating that no serious damage or deterioration of the gears has taken place.
The presence of high amplitude harmonics of both BPFO and BPFI indicates that some deterioration of both the bearing inner and outer ring raceways has occurred and so it was decided to remove the motor for inspection.
Removing the bearings from the motor without incurring damage and thus potentially masking some of the evidence is difficult. In order to provide a more accurate assessment of bearing condition, after removal from the train the motor was run on a test bed at 1500rpm and the vibration spectra are shown in Figure 19.
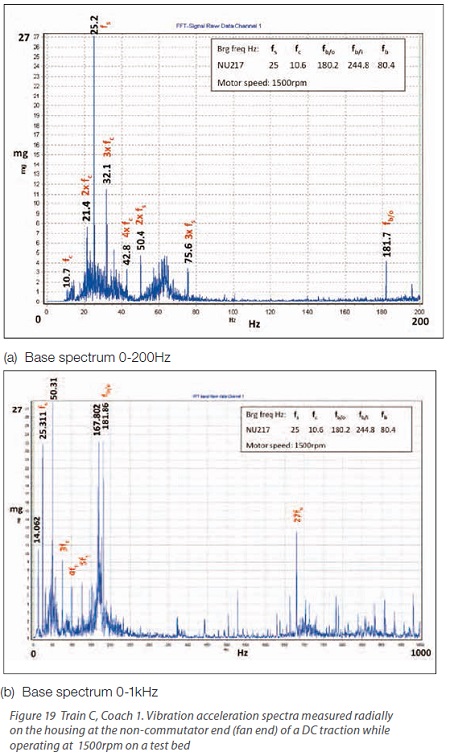
A large dominant vibration is present at shaft speed (25.2Hz) along with vibration at 10.7, 21.4, 32.1 and 42.8Hz, corresponding to the first, second, third and fourth harmonics of cage rotational speed respectively [see Figure 19(a)]. When cage rotational speed is present in the spectrum, it is normally indicative of damage to the cage, the rolling elements, or both. This type of damage is potentially very serious, as the damaged rolling elements may not only produce high vibration and put stress on other components within the transmission system, but will continue to damage the rest of the bearing rolling surfaces.
 In the 0-1kHz frequency range a number of harmonics related to shaft rotational speed (25Hz) can be clearly seen [see Figure 19(b)], with a noticeable peak at the 27th harmonic. There is also a peak at 14.06Hz, which also appears has a sideband at 167.8Hz to the BPFO (fb/o = 181.86Hz) of the NU 217 cylindrical roller bearing. There is no obvious source of vibration for the 14.06Hz frequency, but this appears to be related to the cage speed relative to the inner ring (fc/i = 14.4Hz), which is unexpected as the cage is roller located. This may indicate that some severe cage wear has occurred enabling the bore of the cage to make contact with the inner ring outer diameter.
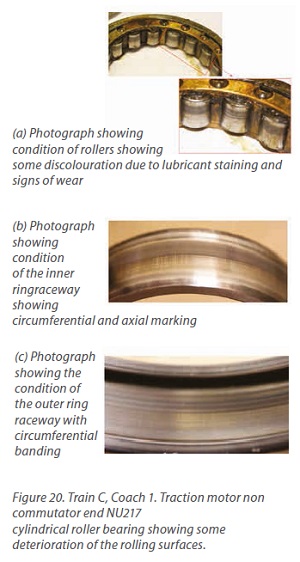
The bearings were removed from the motor and inspected, when it was found that the condition of the bearing rolling surfaces had deteriorated as a result of poor lubrication, with both circumferential and axial marks on both raceways (see Figure 20). On closer inspection of the bearing the cage was found to have wear in the pockets. This bearing was not manufactured by a premium brand supplier and as a result the overall quality was poor. The cage was a riveted design and generally of poor quality both in terms of geometry and surface finish.
6.0 SUMMARY
In some industries, maintenance is the second largest or even the largest element of operating costs and as such becomes a cost control priority. Equipment failure not only affects plant availability but also safety, the environment and product quality. It can also impact on customer service in terms of missed deadlines and loss of confidence.
The complexity and cost of modern plant and equipment means that plant condition monitoring is now becoming a much more cost-effective option. Although many industries have taken, and still do take, a reactive approach to maintenance, since there are no upfront costs, they pay the price in terms of increased plant downtime or lost production.
Vibration monitoring is still probably the most widely used predictive maintenance technique and, with few exceptions, can be applied to a wide variety of assets including plant, equipment and vehicles. Vibration monitoring allows the condition of machinery to be determined as it operates and detects those elements which start to show signs of deterioration before they actually fail, sometimes catastrophically. With this type of approach, unplanned downtime is reduced or eliminated, thereby increasing plant availability and efficiency and reducing costs.
Rolling bearings are a critical element in many rotating machines and generate characteristic vibration frequencies which can combine to give complex vibration spectra which at times may be difficult to interpret other than by an experienced vibration analyst.
In the case of rolling bearings, however, characteristic vibration signatures are often generated in the form of modulation of the fundamental bearing frequencies. This can be used to advantage and vibration condition monitoring software is often designed to identify these characteristic features and provide early warning of an impending problem. This usually takes the form of signal demodulation and the envelope spectrum which indicates early deterioration of the rolling/sliding contact surfaces.
While often simple based vibration parameters can be used to detect a change in condition, diagnosis often requires a more extensive analysis to determine what has failed and why. Equally, just relying on frequency based information for the diagnostics may not be enough and all the information available should be used, including time data.
The successful implementation of condition monitoring relies heavily, not just on the purchase of the right equipment, but on having the right personnel in place to fully implement the maintenance strategy. This means investing in people, particularly in terms of time to measure and analyse the data, and time for training in these skills. Failure to recognise this will seriously limit the benefit that predictive maintenance can deliver, in terms of increased asset availability and reduced operational cost.
Suggested Further Reading
Lacey S J. Vibration Monitoring of the Internal Centreless Grinding process Part 1: Theoretical Models, Proceedings of the Institution of Mechanical Engineers, Vol 24, 1990.
Lacey S J. Vibration Monitoring of the Internal Centreless Grinding process Part 2: Experimental Results, Proceedings of the Institution of Mechanical Engineers, Vol 24, 1990.
Lacey S J. An Overview of Bearing Vibration Analysis, Schaeffler (UK) Technical Publication.
Lacey S J. The Role of Vibration Monitoring in Predictive Maintenance, Schaeffler (UK) Technical Publication.