

ABSTRACT
It is explained that analysing the frequency spectrum is not the only way of monitoring machine vibration, and that measurement and analysis of phase, which is neither difficult to do nor to understand, can enhance the ability to correctly diagnose faults. Here, in Part I, the fundamentals of phase analysis are reviewed, and also how phase can be measured with a single-channel, or dual-channel, data collector, and a strobe. In Part II (in the next issue) it will be shown how these measurements can be used to diagnose a wide range of machine fault conditions.
INTRODUCTION
For so many vibration analysts life revolves around the spectrum. If the fault is not obvious in the spectrum then the fault may not be detected. And in some cases, the fault condition is mis-diagnosed because a number of conditions present themselves in very similar ways. The use of phase readings can help you to differentiate between these conditions. If you master phase analysis, your ability to diagnose faults correctly will be greatly enhanced.
Phase analysis is a very powerful tool. The perception may be that phase measurements are difficult to collect, or possibly that the readings are difficult to understand or interpret. Some may even believe that phase measurements do not offer any useful information. They are wrong. The aim of this article is to show that phase measurements are neither difficult to collect nor difficult to understand.
We will start by revising the fundamentals of phase, and then look at how you can measure phase with a single-channel data collector, a dual-channel data collector, and a strobe.
In Part II (in the next issue) we will look at how these readings can be used to diagnose a wide range of fault conditions: unbalance, misalignment, looseness, bent shaft, cocked bearing, eccentricity and resonance. We will review how comparing phase readings can reveal so much about the machine, and we will take a quick look at Operating Deflection Shape (ODS) and modal analysis.
WHAT IS PHASE?
Phase is all about the relative timing of related events. Here are a few examples:
- When balancing we are interested in the timing between the heavy spot on the rotor and a reference point on the shaft. We need to determine where that heavy spot is located, and the amount of weight required to counteract the rotational forces.
- When we look at fault conditions such as unbalance, misalignment, eccentricity, and foundation problems, we are interested in the dynamic forces inside the machine, and as a result, the movement of one point in relation to another point.
- We can use phase to understand the motion of the machine or structure when we suspect a machine of structural resonance, where the whole machine may be swaying from side to side, twisting this way and that, or bouncing up and down.
So, phase is very helpful when balancing, and when trying to understand the motion of a machine or structure. But phase is also very useful when trying to diagnose machine fault conditions. If your attitude is “the vibration levels are high – it needs to be overhauled”, then you probably don’t care about phase. But if you want to make an accurate diagnosis, and correctly distinguish between faults such as unbalance, misalignment and bent shaft, then phase is an essential tool.
PHASE FUNDAMENTALS
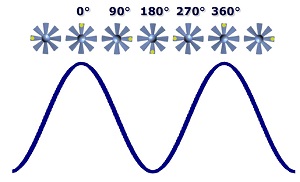
If you measure the vibration from a machine and filter out all sources of vibration, leaving only the vibration at the frequency corresponding to the running speed (i.e a 1X vibration) then the time waveform is a sine wave. The vibration level will be dictated by a number of factors, but let’s just focus on the forces due to unbalance. Let’s use a simple fan as our reference machine. There is a gold coin attached to one of the blades which generates the unbalance force. We see a sine wave with the corresponding angles of rotation as illustrated in Figure 1.
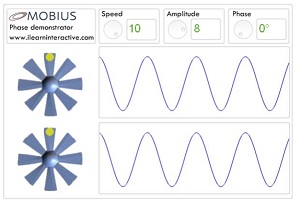
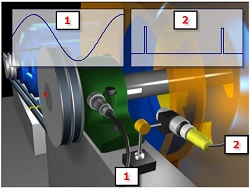
But this information by itself does not tell us very much. Phase is a relative measure, so we need to compare one source of vibration to either another source of vibration or a reference of some kind. First we’ll try to understand phase by comparing two sources of vibration. If we had two identical fans, each with coins on a blade (to generate an unbalance force), we would expect to see sine waves from each fan, as shown in Figure 2. If the fans were perfectly synchronized, such that the coins were both at the 12:00 position at the same time, they would be said to be “in-phase”.
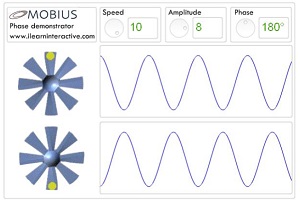
However, if one coin was at the top (12:00) when the other was at the bottom (6:00), they would be “180° out-of-phase”, as shown in Figure 3. Why 180°? Because one rotation is 360°, so half a rotation is 180°.
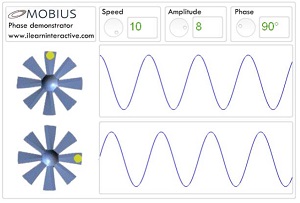
And if one coin was at the top, and the other was a quarter of a rotation around, they would be 90° (or 270°) out of phase, as shown in Figure 4.
COMPARING TWO WAVEFORMS
If you look at the previous examples you can see two waveforms with the same frequency (the fans are running at exactly the same speed). By comparing the two time waveforms we can see the time difference between them. In our example the waveforms have come from two different fans. We are normally interested in two sources of vibration from the same machine.
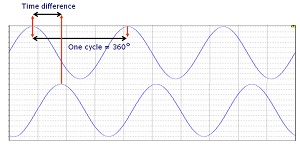
We can determine the phase difference by first measuring the period (i.e. time) of one complete cycle (remember, one cycle is 360°) and comparing that to the difference in time between the waves, as illustrated in Figure 5.
USING A REFERENCE
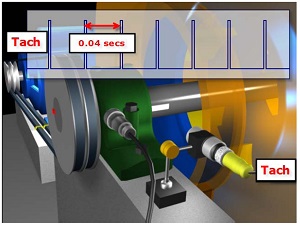
Instead of measuring phase as a time difference between two sources of vibration, it can be measured as a time difference between a source of vibration and a “reference” .The two most common ways of creating such a references are to place a piece of reflective tape on the shaft and then use a photo cell or laser to generate a pulse each time the shaft rotates, or to use a displacement probe opposite a keyway. Each time the keyway passes the tip of the displacement transducer the measured displacement changes dramatically so the signal will have a step change. (We will discuss these measurement setups in greater detail later.) The result is a voltage signal that provides a “TTL” pulse once-per-revolution, as shown in Figure 6. The time between pulses is the period of the machine speed. To keep the numbers simple, let’s assume the fan was rotating at 1500 RPM, or 25 Hz. Therefore the time between the pulses would be 0.04 seconds (1/25 = 0.04).
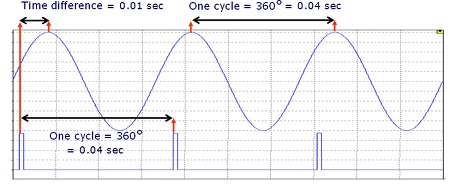
As before, we can compare the vibration from the machine to the reference signal, as illustrated in Figure 7. The time between pulses is 0.04 seconds, and the time between the peaks of the wave would be 0.04 seconds. If there is 0.01 of a second between the pulse and the peak of the wave then the phase difference would be 90°. (Note: ¼ of 0.04 seconds is 0.01 seconds. ¼ of 360° is 90°)
Fortunately, the data collector has the electronics and software necessary to utilise tachometer signals or signals from accelerometers in order to determine the phase angle, so these calculations are performed automatically.
COLLECTING PHASE READINGS
Let’s take a closer look at how we measure phase. In the previous section we described two basic methods: using a tachometer reference, and using the vibration from another sensor. (There is a third method that utilises a strobe, but we’ll get to that later.)
Using a tachometer
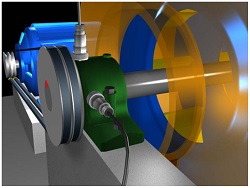
There are a number of ways to obtain a once-per-revolution tachometer signal. The most common involves the use of reflective tape and an optical (or laser) tachometer, as illustrated in Figure 8.
There are a number of products available that can use reflected light, including laser light, to generate the tachometer signal. Some will work without reflective tape, as long as there is an area of high contrast – for example, a paint spot.
The photocell shines a light (visible or laser) on to the shaft. Due to the surface texture and colour, the light does not normally reflect. When the tape passes underneath, the light reflects. The tachometer generates a “TTL” signal that is fed into the data collector.
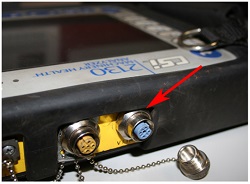
Another way to generate a once-per-revolution signal is to use a displacement (proximity) probe which is aimed at a keyway or setscrew. The change in displacement provides the step in voltage which is used as the reference. This is commercially known as a “keyphasor” (by Bently Nevada). The output from the tachometer is fed into the tachometer input of the data collector; it may be labelled “EXT” or “TACH” or “TRIG” or by some other label. You will need to refer to the operating manual of your data collector to understand where to connect the tachometer signal and how to use it to collect phase readings. Figure 9 is an example of one such data collector, produced by Emerson Process Management (CSi).
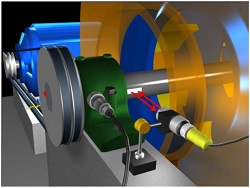
The data collector is then able to use the tachometer signal to determine the speed of the machine, and as a reference to compare the vibration at the running speed (1X) from an accelerometer, as illustrated in Figure 10. It will then provide a phase angle of between 0° and 360° (in some cases the data collector may provide a reading of -180° to +180°).
The data collector can determine the phase angle in a number of different ways. It can apply the two-channel method that will be discussed next, or it can use the tachometer to trigger the data acquisition process and acquire the phase angle from the FFT process.
Using a two-channel data collector
Did you know that when your data collector takes a measurement on a machine, and computes the FFT (spectrum), it actually computes the magnitude (amplitude) spectrum and “phase spectrum”? But because you do not have a reference signal (the data collector starts sampling when you press the button, not according to any pre-defined reference on the shaft) the phase data does not have a lot of value. So it is discarded and we only keep the magnitude spectrum. However, there are two possibilities available to us.
If the data collection was synchronised to the tachometer reference, the phase data would be relevant. We could look at the phase at the running speed and use that information. This is one of the ways that data collectors measure phase when using the tachometer. But there is another way.
If we connect one accelerometer to one channel of a two channel data collector, and we connect another accelerometer to the second channel, the data collector can sample them simultaneously (this is essential) and compare the phase spectra. We would place one sensor at a reference location, and the second sensor at the point of interest, as shown in Figure 11. We can also move that sensor around to different locations to see how the phase angle changes (while leaving the reference sensor in the same location the whole time). In Figure 11 we are measuring the difference in phase between the vertical and horizontal axes.
As you can see, two-channel phase readings (or “cross-channel phase” as it is widely known) are easy to collect. A great many analysts own two-channel data collectors but do not utilise their full potential.
Using a strobe
Stroboscopes can be used to collect phase readings in two ways.
Strobe as a tachometer
If we tune the strobe to the running speed of the machine (so that the shaft or coupling appears to have stopped rotating) the output of the strobe can be connected to the tachometer input of the data collector. The data collector would treat the signal from the strobe as if it were a normal tachometer input. However, if the machine speed varies slightly, the signal from the strobe will no longer represent the exact speed of the machine – the phase reading will be inaccurate. If you set up the strobe so as to freeze a keyway, setscrew or some other point on the shaft or coupling, then you should use that as your reference before you record the amplitude and phase reading. If the speed varies then you will see the keyway/setscrew begin to rotate forward or backwards. You can then adjust the flash rate so that it again freezes.
Data collector driving the strobe or vice versa
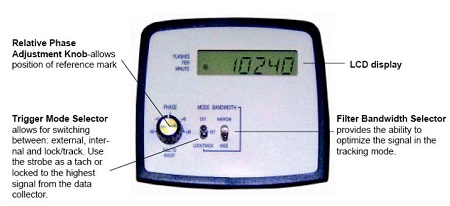
There is another way to use a strobe that is very effective. However, not all strobes or data collectors have this capability. The vibration sensor is connected to the strobe and it is placed in “EXT” mode. You control the flash rate of the strobe until you freeze the motion of the shaft. Switch to “LOCK/TRACK” and the strobe will now use its internal circuitry to filter the vibration signal and extract the vibration at the running speed. The strobe can now track any changes in speed. The strobe will typically have a TTL output signal that can be connected to the tachometer input of the data collector. A sample strobe is shown in Figure 12.
Alternatively, certain data collector models can be used to track the dominant 1X vibration and drive the strobe. The data collector can either track the 1X speed automatically, or you can move the cursor on a spectrum to set the speed. A cable is connected from the output of the data collector to the input of the strobe. The flash rate of the strobe is now under the control of the data collector. If the machine speed varies slightly, the flash rate of the strobe, and the trigger signal, will be automatically corrected.
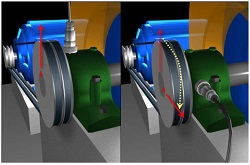
When the strobe or data collector is set to track the running speed you can perform “visual phase measurements”. The strobe will flash at the running speed of the machine, thus the shaft (or coupling) will appear to freeze. (Of course, you must be very careful – the shaft has not stopped and you must be careful not to touch it.) You should then set a visual reference, like a keyway or setscrew, and use the “Relative Phase” knob on the strobe to adjust the keyway/setscrew so that it is at the 12:00 position.
If you watch the shaft/coupling while you move the accelerometer, it will appear as if the shaft/coupling rotates. The amount of rotation is dictated by the phase difference between the original sensor position and the new position. For example, if the machine was out of balance and you move the accelerometer 90º, the shaft/coupling will appear to rotate 90º (a quarter turn), as demonstrated in Figure 13.
This is a very effective phase analysis method. As you move the sensor around the machine you can see how the phase changes without even looking at actual phase values. It is best if you can use a setscrew, keyway, paint spot, or reflective tape as your visual reference. You should start by adjusting the strobe so that the reference is at the top of the shaft. As you move the sensor it is very easy to note the change in phase.
USING THE PHASE READINGS TO DIAGNOSE FAULT CONDITIONS
In Part 2 of this article we will investigate how to utilise the phase readings to diagnose fault conditions. We can do this in a very simple way, by comparing the readings between two axes or two points on the machine (utilizing a bubble diagram to make it easier to keep track of the readings), or we can utilize more sophisticated software to animate the movement of the machine and supporting structure. Suffice to say that the phase readings allow us to understand the relative motion of the machine.
We investigate whether two points are in-phase, 90° out-of-phase, 180° out-of-phase, or some other relationship. The two points being compared may be two points on either side of the coupling, two points at either end of a component, or between two axes (e.g. horizontal and vertical) at the same location.
Phase is a great diagnostic tool, and if you have a dual-channel data collector or a strobe it is very easy to acquire and interpret the readings.
For further information contact:
 Dean Whittle, Reliability Maintenance Solutions Ltd,
No.42 Goldcrest Close, Longridge Park,
Colchester, Essex CO4 3FN. United Kingdom.
Tel: Fax: +44 (0)1206 791917;
Fax: +44 (0)1206 791917
 Jason Tranter, Mobius Institute,
280 Myers Road, Merricks North,
Victoria, 3926. Australia.
Tel: +61 3 5989 7285;
Fax: +61 3 5989 7393;
Email jason@iLearnInteractive.com
© Copyright, Mobius Institute 2007
© Copyright, Reliability Maintenance Solutions 2007