ABSTRACT
Engineers will recognise that cheapest to buy is not always cheapest to run. Yet when it comes to investment decisions, capital cost comparisons can have an influence like the Sirens’ call. Most engineers will also be familiar with troublesome assets that fail to perform as anticipated and soak up more time and resources than they should. Both these situations remain unchallenged where behaviour is driven by a narrow focus on direct costs.
Lifecycle costing, combining capital and multi-year operating costs into a holistic measure of cashflow, is well known but it is often seen as a complex, difficult to apply financial analysis tool. Yet in most cases, a simple LCC model, taking under an hour to complete, will be sufficient to widen the basis of decision-making, leading to improved performance of both current and future assets.
This article explains how lifecycle cost principles can be applied in a simple but practical way to guide decision-making about how to:
• Achieve the full potential of current and legacy assets
• Make informed decisions that reduce lifecycle costs even when individual asset cost data are not available
• Guide the development and implementation of working methods to realise the full potential of assets or increase value added from new assets prior to day one operation
• Begin conversations about the impact of future challenges to encourage innovation, engagement and an active improvement culture
When to use lifecycle costing
Lifecycle costs analysis adds most value when used to guide choices between future options, such as upgrading current assets versus new assets. Think of it as a compass guiding the journey to optimum performance. To stick with the compass analogy, selecting a north-west rather than a northerly direction can be made with confidence using a simple compass from a Christmas cracker. Likewise adopting a simple LCC model to compare investment options first may be all that is needed.
Naturally it is useful to have an understanding of the total cost implications of any decision, but lifecycle cost models present an approximation of the real world. Those that approach LCC analysis seeking a precise forecast of future costs will be disappointed. The pursuit of high levels of accuracy adds complexity and may not improve the quality of decisions made. There are too many variables in the real world to forecast accurately even a year ahead, let alone five or more years.
Like any compass, the value LCC provides is zero without a clear destination in mind. For that reason, an early question to answer is “what decision do we need to make?”; then ask what is needed to support that decision. As mentioned above, start simple.
The conversations surrounding the creation of the model and interpretation of the outputs are as valuable as the model outputs themselves. Creating a lifecycle cost model generates conversations about cause-effect mechanisms and the likely form or impact of future challenges. That in turns leads to shared insight, consensus and highlighting of gaps in knowledge. As a result, the LCC model development process generates triggers for innovation and new thinking.
For example, some organisations use LCC models when tapping into potential gains from the wider availability of cheap advanced technology. Those that do this well use cross-functional teams led by internal technology specialists to identify where low-cost pockets of automation can bring about gains. In most cases, because the technology is new, these internal specialists have been developed in house. Their “classrooms” are practical projects, their “curriculum” is set by near-future business drivers using lifecycle cost Models as their compass and scorecard.
In summary, lifecycle costing and its supporting principles add value to decisions involving a choice between promising options. The application examples below cover a range of suitable applications including:
- Where to target resources to improve current asset performance
- Decisions about overhaul versus replacement of legacy assets
- Targeting of capital investment for new assets/asset features.
Improving current asset performance
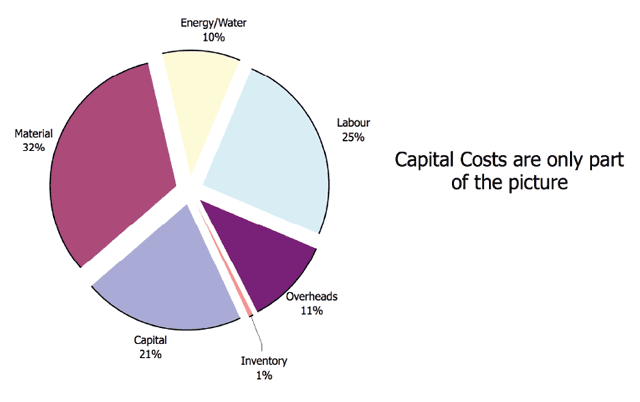
Where legacy assets are troublesome, an instinctive reaction to replace them with new ones can seem compelling. The simplest application of lifecycle cost analysis can help to counter this instinct by making asset lifecycle cost drivers visible. The pie chart in Figure 1 was developed as a base case LCC model combining capital costs with anticipated operating costs over five years.
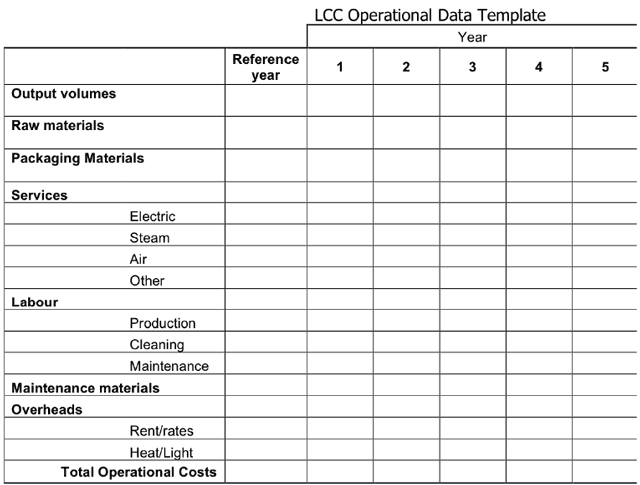
Operational costs for the model were collated using the data template shown in Figure 2.
It is highly likely that the asset will last longer than five years, but 3-5 years was the strategic planning horizon for this organisation. That meant we could use the strategic planning assumptions and other activities expected to take place during that period.
Furthermore, a cost model using five years’ operating costs means that options considered must create an annual return equivalent to 20% to achieve a lower overall total cashflow. This simplification does not affect the value of the model if it is used as the basis for comparing options.
In this case, the model was used to identify the cashflows that could be expected from a like-for-like replacement of a multi-stage production line. This provided a benchmark for comparison of options.
Figure 3 shows an overall equipment effectiveness (OEE) analysis of the current asset to identify potential for improvement without investment in a new asset.
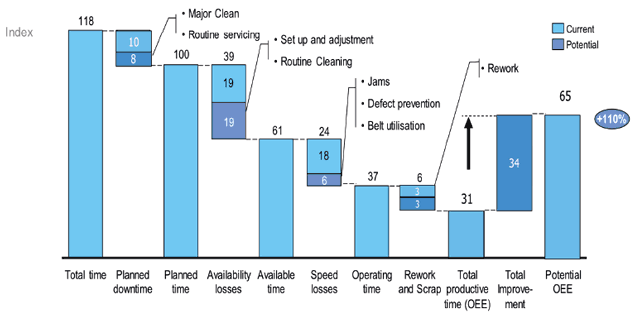
This identified the potential to more than double current levels of effectiveness (and therefore capacity) by:
- Improving methods to reduce set up, cleaning time and rework;
- Improving condition of critical parts of the asset to reduce breakdowns
- Making minor upgrades to process control
- Improving upstream processes which had a significant impact on rework and yield issues.
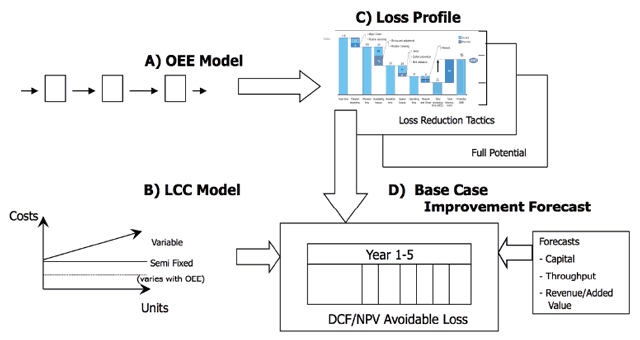
This combination of OEE analysis with the lifecycle cost data demonstrated that these actions would bring about energy and material gains equivalent to around 7% of lifecycle costs. The impact of increased throughput on profitability was also added to the model as a positive cashflow. The outcome was an option with similar operational gains at around 10% of the capital cost.
Reducing lifecycle costs
The above review included consideration of contributors to sub-optimum lifecycle costs due to weaknesses in technology, operational methods and product/customer value features. using the six factors set out in Figure 5 below to guide the assessment of the current equipment against six design goals – safety, reliability and so on.
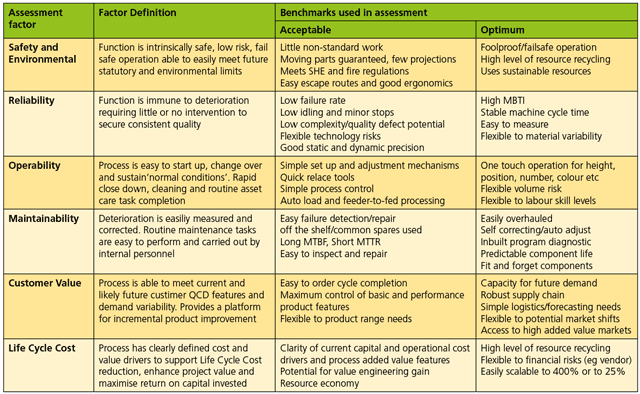
Safety and reliability benchmarks highlighted technology weaknesses, operability and maintainability highlighted complexity of operational methods, and customer value and lifecycle cost benchmarks highlighted the impact of product/customer value features. The review then identified specific weaknesses that contributed to sub-optimal lifecycle cost performance.
Following that, a simple hierarchy of options for improvement were considered to assess the potential benefits of:
- Restoring equipment basic conditions;
- Improving working methods;
- Improving process control/reducing process complexity;
- Low cost automation.
This generated options to:
- Improve methods by enhancing:
- Reference planes at points of adjustment;
- Clamping;
- Positioning of parts in fixtures;
- Centring/alignment.
- • Improve asset resilience by improving:
- Access to key equipment areas;
- Containment of dust and contamination;
- Ease of start up, change over, run and close down;
- Hard to clean areas.
- • Reduce complexity by making it easier to:
- Distinguish between product variants;
- Assemble mechanisms after cleaning;
- Replenish materials on line.
This example shows how conducting lifecycle cost analysis of existing assets before resorting to capital investment will ensure that scarce capital resources are targeted at those areas where they can add the most value.
Decisions about overhaul versus asset replacement
Another useful application of LCC modelling is support for overhaul versus asset replacement decisions. This involves creating a model of future maintenance cost such as the model overleaf. This model uses cumulative capital and maintenance costs per 1000 run hours to predict the curve of future maintenance costs. Other versions are available.
Asset history was used to identify the cumulative cost per 1000 run hours for the asset to date. Regression analysis was then used to identify the a and b parameters of the formula Y = ax²+bx+c (see Figure 6) where Y is the estimated maintenance costs at a future level of run hours (x).
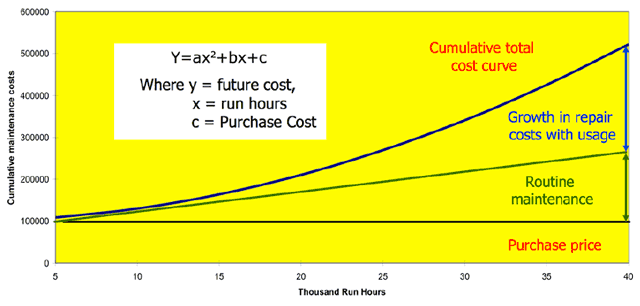
As can be seen from figure 7, the nature of the cumulative cost curve is an increasingly steep rise as the run hours increase and more costly repairs are needed to restore operations.
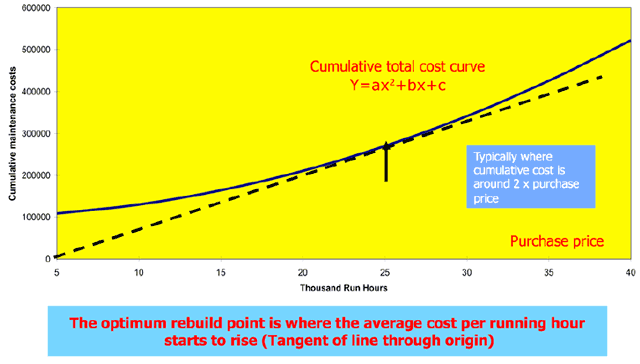
A tangent to the curve passing through the origin is the point at which cost per 1000 run hours starts to rise. (As the model includes capital and running costs, up to this point cost per 1000 run hours will decrease).
An overhaul at this point will change the shape of the maintenance cost curve to that of the earlier, flatter part of the curve. That provides a basis for assessing the payback from the cost of the overhaul. These costs can then be used in an LCC option and compared with the base case to identify the gains from a new asset.
Targeting investment for new assets/features
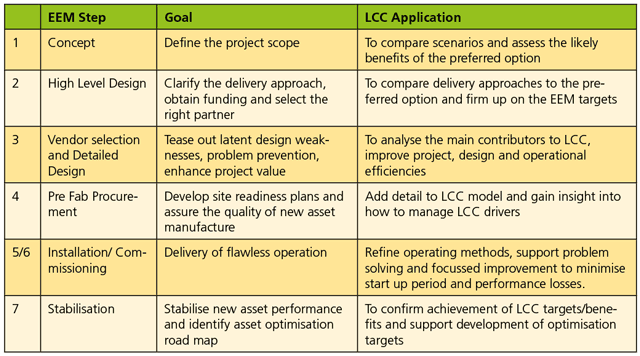
Undertaking capital equipment projects with lowest lifecycle costs is one of the goals of early equipment management (EEM). This approach is sometimes referred to as design to lifecycle costs or DTLCC. The scope of this approach starts with investment decision-making, and includes design and delivery processes and optimisation of asset performance to achieve maximum value added over the life of the asset (see Table 1).
As mentioned earlier, in most cases, a simple LCC model will be sufficient to support a comparison of options under consideration.
In some cases, it may be necessary to build on this and create a more detailed LCC analysis, for example to:
- Support a fund application;
- Review decision sensitivity to best case/worst case business scenarios;
- Gain a greater insight into risks/opportunities.
Table 1 sets out lifecycle cost model application areas over the life of a capital project.
Lifecycle cost model development
Lifecycle cost models are of most value when they are developed on a cross-functional basis using parameters aligned with assumptions and planning criteria used by other business systems such as:
- Site business plans;
- Capacity planning models;
- Financial rules of thumb.
As mentioned above, the process of developing this across functional boundaries improves insight, consensus and engagement with the outputs of the analysis.
Figure 8 sets out the steps and cross-functional roles involved in developing and using the lifecycle cost analysis.
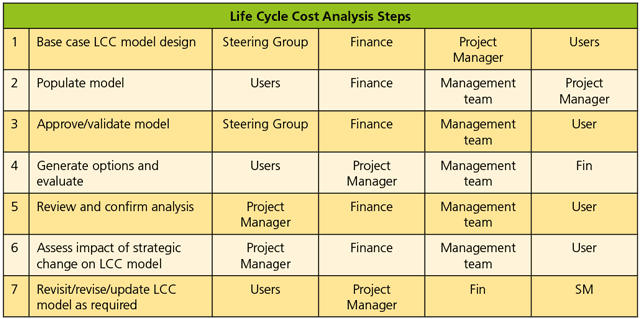
Steps 1-4: Define and validate the base case LCC model.
Steps 4-6: Cover development of options for review and evaluation to identify a preferred approach.
Step 6: Confirm/refine preferred approach based on strategic risk assessments/scenario plans.
Step 7: Update LCC model as required.
Case study example
Below is an example of how LCC analysis was used to evaluate two competing options by comparing them against a base case model. In this example a base case model had already been developed containing the lifecycle cost flows used to support the justification of the capital spending. The review was part of the early equipment management process to assure achievement of those targets by seeking to further reduce LCC and enhance the project’s added value. As part of that activity, the two options under consideration here had been previously shortlisted from a list of seven.
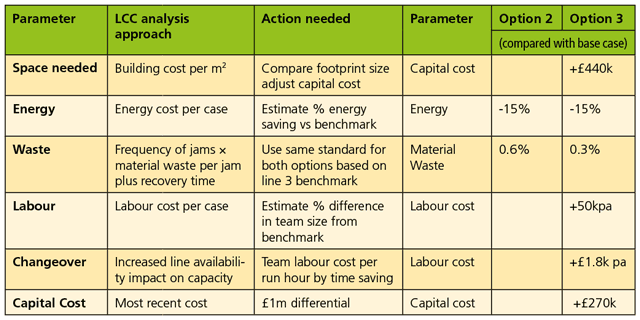
The first step was to identify the base case parameters to be adjusted to create the LCC estimate for each option. This is set out in Figure 9.
As shown in figure 10, option 3 resulted in a lifecycle cost of £108,000 lower than base case model cost. Option 2 resulted in a LCC of £537,000 higher than the base case.
As both options were compared using a base case model, the difference between the two options of £645,000 was defensible even though the base case model was relatively simple. Had the difference been closer, a more detailed analysis would have been carried out but in this case, that was not necessary.
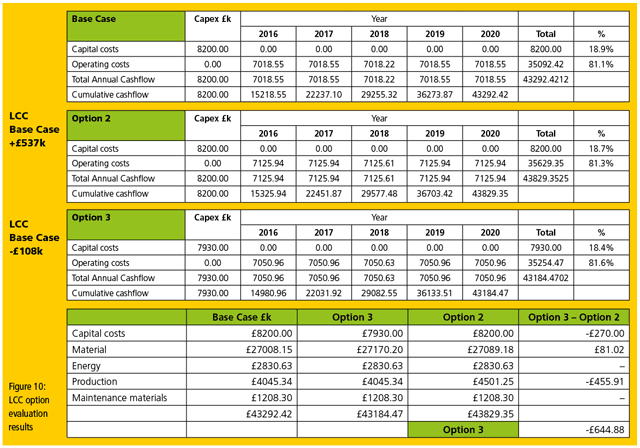
In this case study, the base case lifecycle cost model had already been created, which meant that the above comparison took less than 30 minutes to complete.
Conclusions
Lifecycle cost analysis provides an insight into total operational cashflows to improve decisions about where to target those scarce resources of skilled labour and investment capital to improve future business performance. The process of creating and using that information moves the conversation on from discussions about dealing with the consequences of failures to a topic where engineers add the most value: the future.

