Developments in instruments and software mean that ultrasound analysis can play a key role in detecting and diagnosing mechanical and electrical failures. Chris Hallum, UE Systems regional manager for the UK & Ireland, explains.
Ultrasound is no longer limited to leak detection. Advances in instrumentation and software have given users the ability to accurately diagnose electrical conditions such as corona, tracking, and arcing. In mechanical inspections bearing faults, pump cavitation, and valve problems can be pinpointed. In both cases, the ultrasound naturally emitted by the mechanical or electrical process is detected, analysed, and translated into an audible sound signature that the user can listen to as part of the process of diagnosis.
Mechanical inspection
Reciprocating compressor valves are very noisy and produce a lot of extraneous vibration. Because ultrasound is highly directional, it is possible to differentiate between sound emitted by different sources and isolate the one that is relevant to the object being inspected. This means it is possible to listen to and view the sounds of such noisy valves in real time, and to determine when a valve is leaking.
How would you imagine the sound of a “good” compressor valve? As it opens and closes, there will be a definite pronounced clicking. What about a bad valve? Below are two examples of recorded ultrasound signatures of reciprocating compressor valves, viewed in the time series in spectrum analysis software.
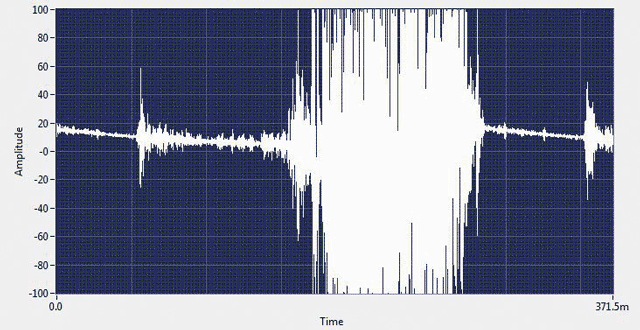
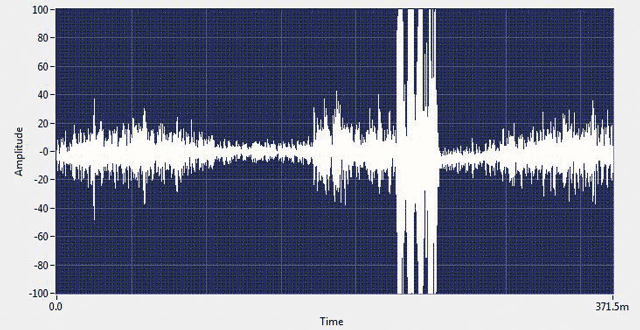
The good valve shows the valve open for a very distinct and short time, after which it closes quickly. The faulty valve is open for a much longer time.
Below is another example, comparing two motor and pump combinations from a group of eight. The pump motors were 60hp items.
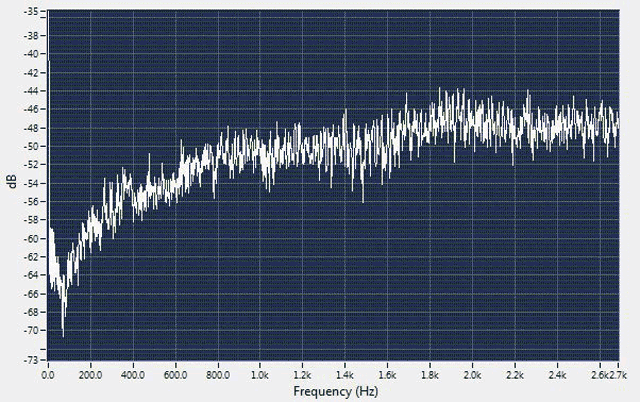
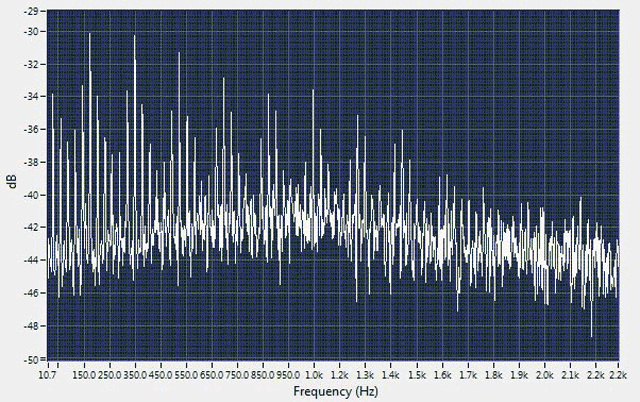
Both decibel readings and sound files were recorded. The screen shots above show a comparison between the readings for pumps 3 and 4.
Notice the difference between the two. Both motors are operating under the same conditions, but the Pump 4 observation has a very different spectrum from Pump 4. If you were listening through the headset of the ultrasound instrument, you would hear a distinctly different sound.
Another image captured from Pump 4 by the ultrasound instrument is shown below. Notice that distinct 175.8Hz harmonics are detected.
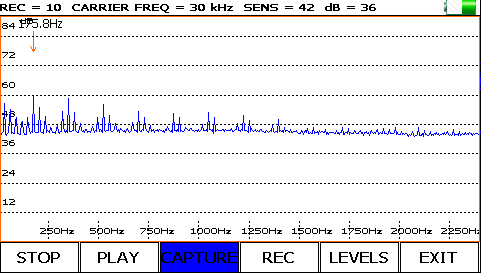
The spectrum analysis software used has a built-in bearing fault frequency calculator. If the user enters the speed (in rpm) and the number of ball bearings, the software will calculate inner and outer race ball pass frequencies, and cage frequency. For this motor, the speed was 1750rpm and the number of bearings was 10. The software calculated the expected inner race fault frequency would be 175Hz – the same fault harmonic detected on the ultrasound instrument.
Electrical inspection
The application in which ultrasound use has increased the most in the last few years is electrical inspection. Ultrasound can be used to listen for electrical conditions such as corona, tracking, and arcing. Each anomaly has a distinct sound, and can easily be identified and confirmed through the use of ultrasound imaging.
Corona, the ionisation of air surrounding an electrical connection above 1000V, is heard via the ultrasound instrument as a steady, uniform, static sound. Looking at the recorded ultrasound of corona in spectrum analysis software, very distinct and evenly spaced peaks or harmonics can be seen.
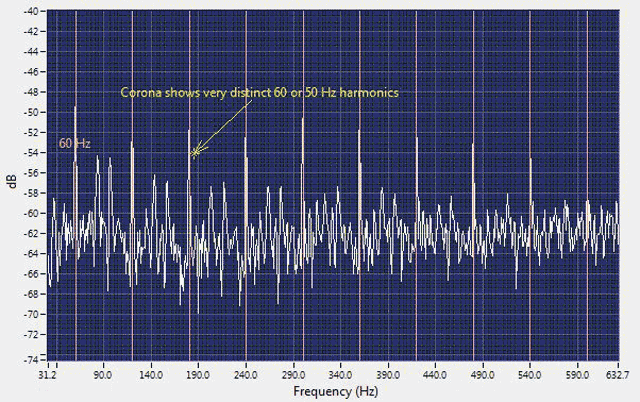
The harmonics appear every 50Hz, or 60Hz in the US, the same as the supply frequency. You can also see frequency content, peaks within the peaks, between the harmonics. Being able to detect corona with ultrasound is particularly helpful because the phenomenon typically does not produce sufficient heat to be detected by infrared.
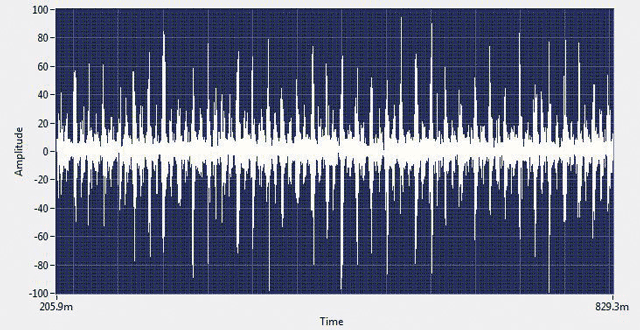
In electrical inspection, the well-defined 50Hz or 60Hz harmonics will diminish as the condition becomes more severe. The example below is from a recorded sound file of tracking (in which conductive tracks are formed by carbonised dust, which can lead to a short circuit). Typically, it has a more distinct continuous frying and popping sound. Also notice the greater amplitude, indicating a more intense sound compared with corona.
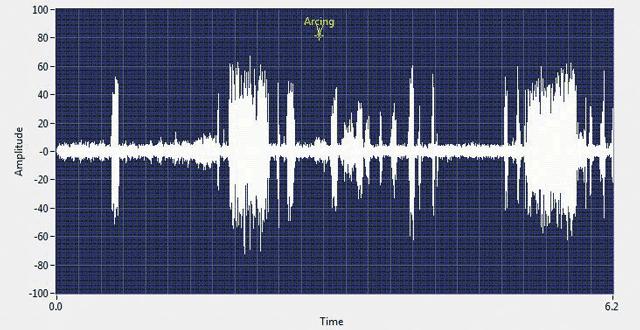
The loss of uniform harmonics is even more evident in the analysis of arcing. Here, the electrical discharge becomes more erratic and has sudden starts and stops.
In summary, airborne and structure-borne ultrasound instruments have become a perfect complement to infrared and vibration analysis tools, and many engineers would consider ultrasound a must-have technology for any maintenance and reliability programme.

