

By opening a digital window to visualise their compressed air energy consumption in real time, production teams can defend against rising costs and achieve operating efficiencies with relatively little effort, writes Darren Pratt, Industrial Instrumentation Product Manager for SICK UK.
As the so-called ‘fourth utility’ of manufacturing, compressed air systems can frequently be the cause of wasted energy. Yet opportunities for savings are all too easily overlooked.
By feeding the data from accurate sensing instruments into new cloud-based monitoring systems, sensor manufacturers like SICK are introducing digital services that are easy to ‘bolt on’ to existing processes with minimal set-up and no programming. The results can be remarkably revealing.
Compressed air accounts for 10% of energy use in a typical manufacturing operation, rising to 30% in heavy use industries such as food and beverage, automotive, plastic products and pharmaceuticals, according to the British Compressed Air Society.
It is estimated that manufacturers waste around 30% of the compressed air they generate. But, until now, operators have only been able to get a limited grasp on how much energy is actually being used by their compressed air systems. Tracking down and fixing leaks can be a laborious, hit and miss affair.
Even with a modern energy management system in place, a maintenance team may only survey the plant every three or six months. External companies may be brought in to conduct periodic spot check audits. The data provided is reliable only for one moment in time, and very little can be gleaned from it about any trends or patterns.
Bolt-on’ Transparency
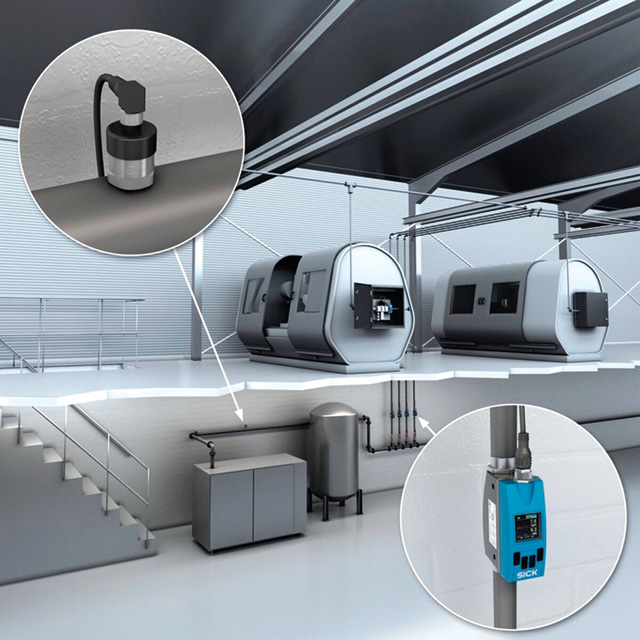
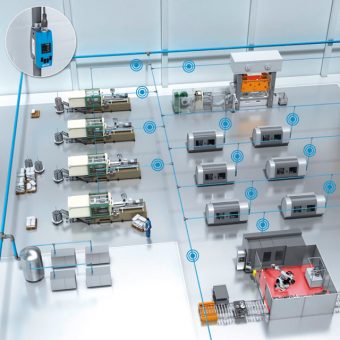
The SICK FTMg is a multifunctional flow sensor that enables the measurement of live values for compressed air energy in kWh. Using data from SICK FTMg flow meters strategically positioned around a plant, and usually close to machines or cells, a wealth of both real-time and historic data about compressed air usage, including energy consumption, is available.
collect data on compressed air usage
Data is made transparent through graphics presented in the SICK FTMg Monitoring App. Users can visualise continuous compressed air data in a way that is easy to use and interpret. As well as values for pressure, temperature, flow velocity, mass flow rate and volumetric flow rate in real time, the system provides totals for energy use, volume and mass over a pre-defined period.
The user-friendly dashboard makes it easy to interpret data to detect leaks or overconsumption and to look for changes and trends. Email alerts can be set up for maintenance reminders or to give pre-defined warnings with job recommendations, for example, when data strays beyond pre-defined limits. Users can drill down to identify costs, for example for individual production centres or by shift.
Unexpected Data Insights
We are seeing how early adopters of the FTMg Monitoring App are gaining unexpected insights. They have been able to make startup and shutdown management of processes and machines more efficient, improve compressor control, and manage peak loads.
By tracking consumption over time, losses are easier to spot and correct. For example, energy waste is clear if the compressed air usage graph does not baseline close to zero at weekends. Is there a surge in power usage on a Monday morning when machines are turned on? Then, perhaps, a more efficient power-up sequence could be adopted to prevent overloading the compressor.
The system makes it possible to monitor energy usage close to the machine cells. Production teams can pose specific questions: How much air is cell number 1 using, compared to cell number 2? If cell number 3 uses a lot more compressed air energy, then keep it offline as long as possible. How much compressed air energy is needed to produce one type of component compared to another?
The information can contribute towards ISO50001 Energy Management certification, or compliance with the UK Government’s Energy Saving Opportunity Scheme (ESOS). For customers wishing to integrate SICK FTMg flow meters into their own IT systems, one or more devices can be used with an IIoT gateway, such as the TDC-E from SICK, for data pre-processing and integration into customer-specific MES, cloud or energy management systems.
www.sick.co.uk | andrea.hornby@sick.co.uk | t: 01727 831121